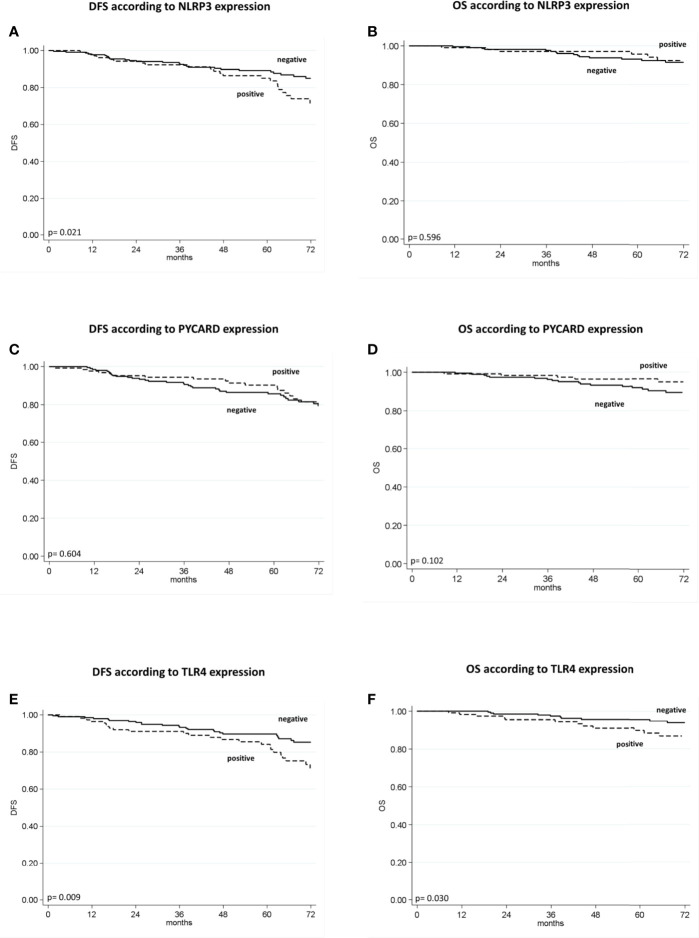
Figure 3.
Kaplan–Maier curve analysis and log-rank test. (A) Kaplan–Maier curve for disease-free survival (DFS) according to NLRP3 positive versus negative patients (85% vs. 89%; 95% CI, 78-92 vs 85-93; p = 0.021); (B) Kaplan–Maier curve for overall survival (OS) according to NLRP3 positive versus negative patients (96% vs. 93%; 95% CI, 92-100 vs 90-97; p = 0.596); (C) Kaplan–Maier curve for DFS according to PYCARD positive versus negative patients (90% vs. 86%; 95% CI, 81-91 vs 85-96; p=0.604; (D) Kaplan–Maier curve for OS according to PYCARD positive versus negative patients (96% vs. 92%; 95% CI, 93-100 vs 88-96; p = 0.102); (E) Kaplan–Maier curve for DFS according to TLR4 positive versus negative patients (84% vs. 90%; 95% CI, 77-91 vs 85-94; p = 0.009); (F) Kaplan–Maier curve for OS according to TLR4 positive versus negative patients (90% vs. 96%; 95% CI, 84-96 vs 93-98; p = 0.036).

