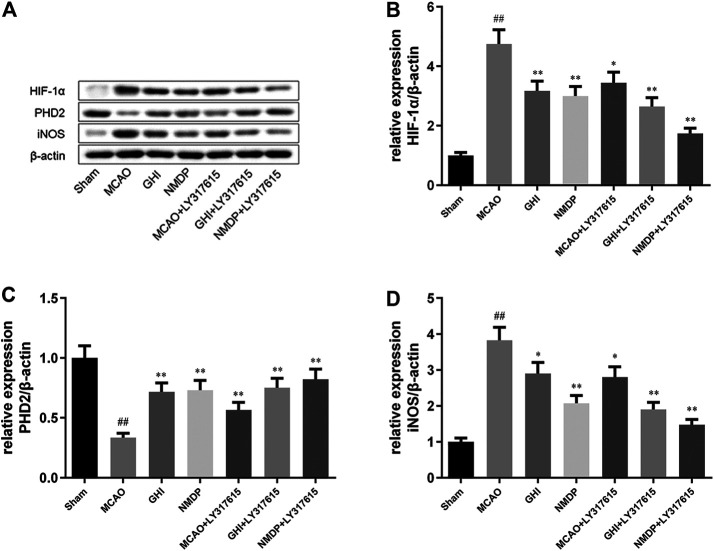
FIGURE 7.
Representative photographs of Western blotting (A); the expression of HIF-1α (B), PHD2 (C), iNOS (D) protein in rat after I/R for each group (±SD, n = 3). #, compared with the Sham group; *, compared with the MCAO group; “##” and “**” means that the p value is less than 0.01; “#” and “*” means that the p value is less than 0.05.

