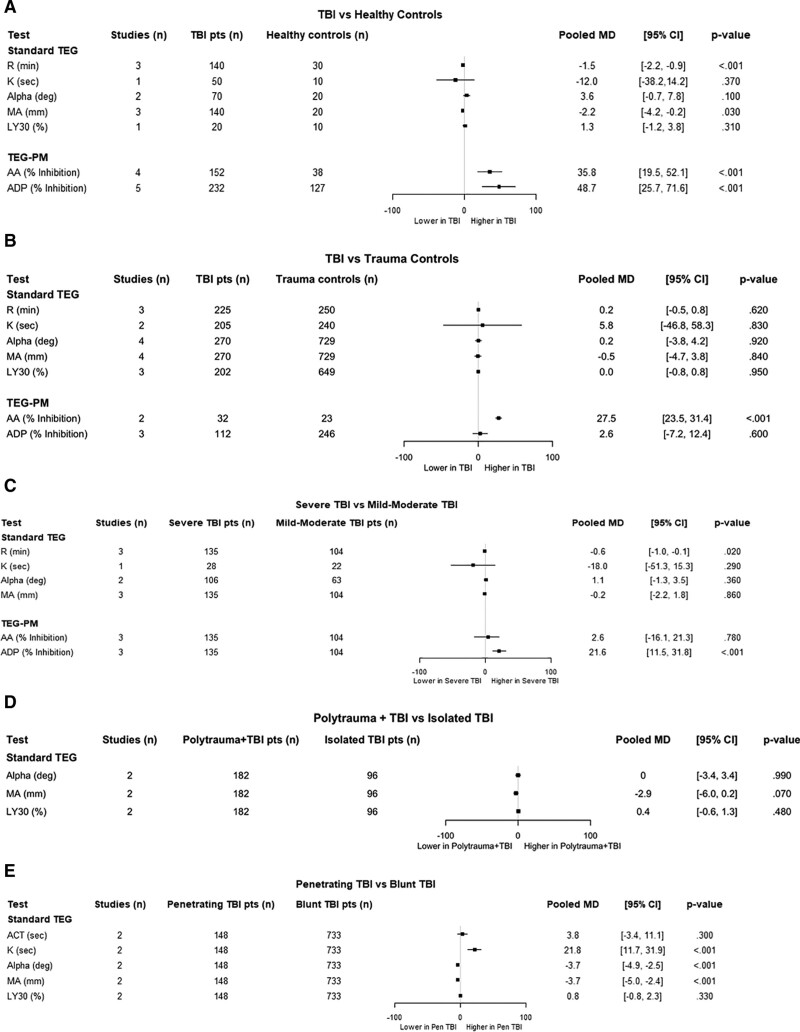
Figure 2.
Thromboelastography (TEG) profiles in traumatic brain injury (TBI) patients at admission. A, TBI compared with healthy controls. B, TBI compared with trauma controls without TBI. C, Severe TBI compared with mild to moderate TBI. D, Polytrauma patients with TBI compared with isolated TBI. E, Penetrating TBI compared with blunt TBI. Data are presented as pooled mean difference (MD) for each individual assay obtained on initial patient evaluation. AA = arachidonic acid, ACT = activated clotting time, ADP = adenosine diphosphate, LY30 = clot lysis at 30 minutes, MA = maximum amplitude, pts = patients, TEG-PM = thromboelastography with platelet mapping.

