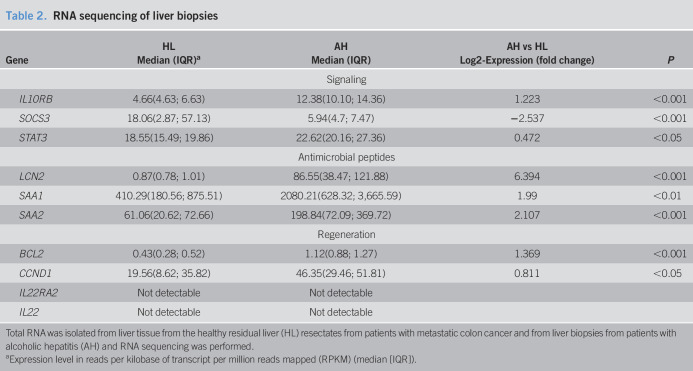
Table 2.
RNA sequencing of liver biopsies
| Gene | HL | AH | AH vs HL | P |
| Median (IQR)a | Median (IQR) | Log2-Expression (fold change) | ||
| Signaling | ||||
| IL10RB | 4.66(4.63; 6.63) | 12.38(10.10; 14.36) | 1.223 | <0.001 |
| SOCS3 | 18.06(2.87; 57.13) | 5.94(4.7; 7.47) | −2.537 | <0.001 |
| STAT3 | 18.55(15.49; 19.86) | 22.62(20.16; 27.36) | 0.472 | <0.05 |
| Antimicrobial peptides | ||||
| LCN2 | 0.87(0.78; 1.01) | 86.55(38.47; 121.88) | 6.394 | <0.001 |
| SAA1 | 410.29(180.56; 875.51) | 2080.21(628.32; 3,665.59) | 1.99 | <0.01 |
| SAA2 | 61.06(20.62; 72.66) | 198.84(72.09; 369.72) | 2.107 | <0.001 |
| Regeneration | ||||
| BCL2 | 0.43(0.28; 0.52) | 1.12(0.88; 1.27) | 1.369 | <0.001 |
| CCND1 | 19.56(8.62; 35.82) | 46.35(29.46; 51.81) | 0.811 | <0.05 |
| IL22RA2 | Not detectable | Not detectable | ||
| IL22 | Not detectable | Not detectable | ||
Total RNA was isolated from liver tissue from the healthy residual liver (HL) resectates from patients with metastatic colon cancer and from liver biopsies from patients with alcoholic hepatitis (AH) and RNA sequencing was performed.
Expression level in reads per kilobase of transcript per million reads mapped (RPKM) (median [IQR]).

