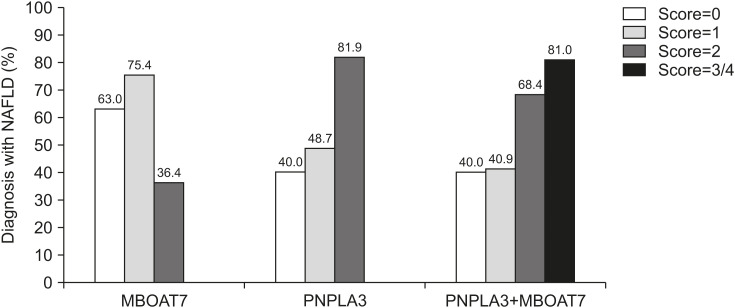
Fig. 1. Association between the genetic risk score and NAFLD diagnosis. Risk score was counted and added for each patient: number of T alleles in MBOAT7 rs641738 (score 0 to 2), number of G alleles in PNPLA3 rs738409 (score 0 to 2), and number of T and G alleles when MBOAT7 rs641738 and PNPLA3 rs738409 were combined (score 0 to 4). Only a few patients had a score of 4, thus were counted as having a score of 3 and together labeled as 3/4. The effect of genetic risk score on NAFLD diagnosis was analyzed in a general linear model with covariates sex, age, and z-score to obtain the p-values. The cohort was grouped based on the total risk scores from 0 to 3/4, and percentage of NAFLD in each risk score group was calculated and presented in the Y-axis of the figure.
Left column grouping: MBOAT7 rs641738 risk score as the dependent variable. Risk score has no correlation with NAFLD (p=0.747) or other covariates (p>0.05). Middle: PNPLA3 rs738409 risk score as the dependent variable. Risk score shows significant correlation with NAFLD p<0.001 and none in other covariates (p>0.05). Right: The combining risk scores of MBOAT7 rs641738 and PNPLA3 rs738409 as the dependent variable. Risk score shows significant correlation with NAFLD (p=0.002), and none in other covariates (p>0.05). p<0.05 was considered statistically significant.
NAFLD: nonalcoholic fatty liver disease, MBOAT7: membrane-bound O-acyltransferase domain-containing protein 7, PNPLA3: patatin-like phospholipase domain-containing protein 3.

