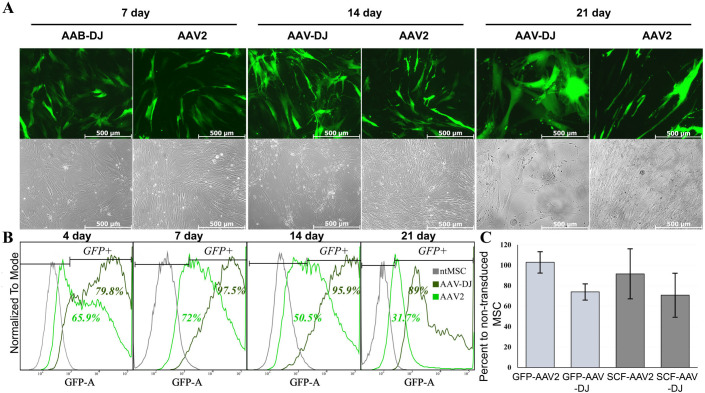
Fig. 1.
GFP expression efficiency in human MSCs after transduction with AAV-DJ or AAV-2. (A) top panels show representative fluorescence photomicrographs of transduced cells (green channel) at 100× magnification; lower panels shows the same field of view in phase contrast. (B) Typical flow cytometry histograms showing GFP expression in human MSCs transduced with AAV2 or AAV-DJ from 4th to 21st day. The percentage of GFP-positive cells in intact MSC (control) or transduced with AAV-DJ showed at the top of the frame. (C) Trypan blue stained MSC were counted at a magnification of ×100 in triplicate. Data are expressed as mean±s.d.

