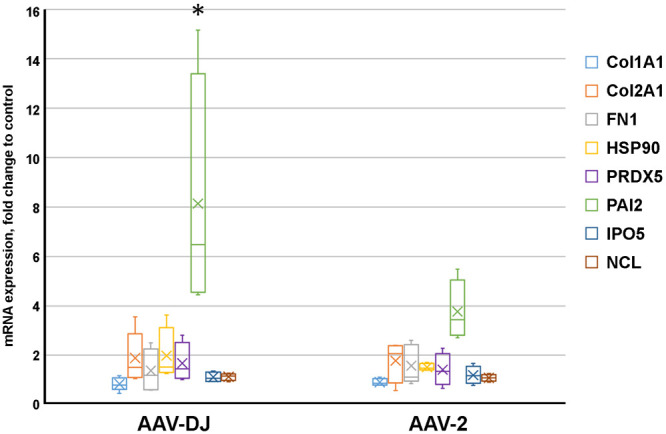
Fig. 2.

Comparison of changes in gene expression levels in human MSC after transduction with AAV-DJ or AAV-2. Box plot showed the normalized relative mRNA expression of nine genes, at 7th day after transduction with AAV-viral vectors assessed by real-time PCR analysis. Values were calculated as ratio to mRNA expression levels in intact MSC. The thick line inside the box plot indicates the median expression levels and the box shows the 25th and 75th percentiles, while the whiskers show the maximum and minimum values. Statistical significance of expression changes in AAV-DJ vs AAV2 was determined using the t-test (P<0.05).
