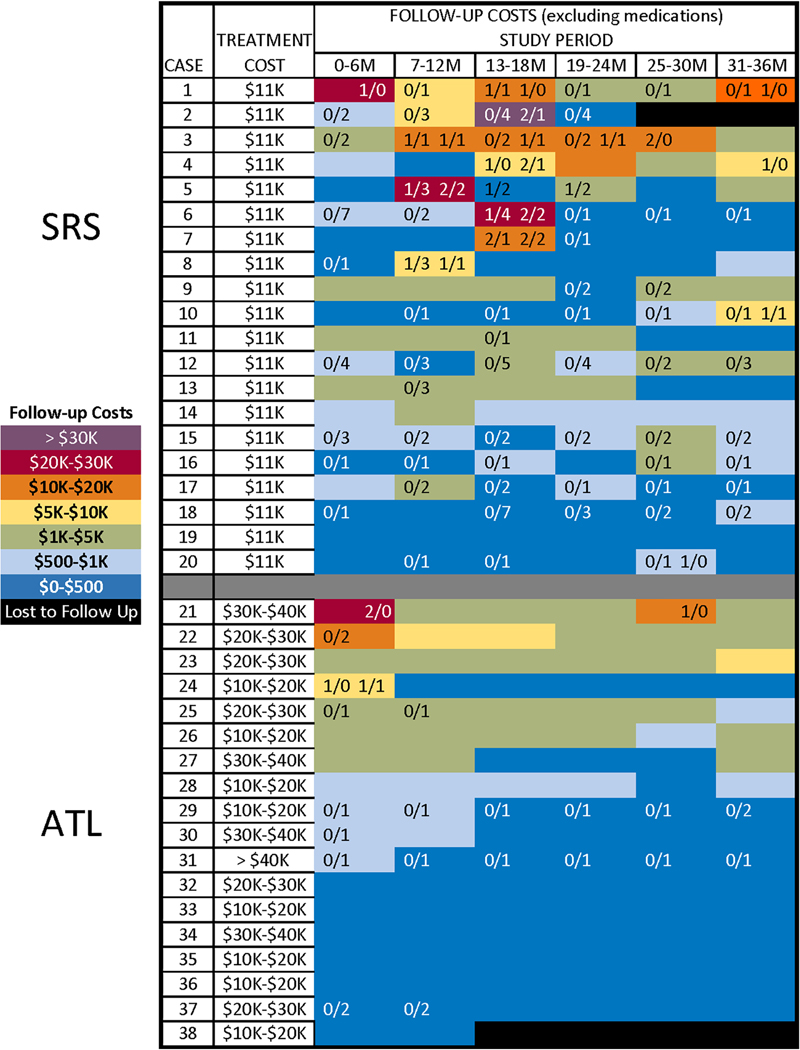
Figure 1.
Treatment cost ranges and direct medical costs (excluding AEDs) across follow-up for each study participant, by arm. Blue-to-red shading within cells represents increasing cost. Numbers on the left half of each cell are the number of serious AEs (to the left of the “/” mark) and non-serious AEs (to the right of the “/” mark) experienced during the period. Numbers on the right half of each cell are the total number of hospitalizations (to the left of the mark) and AE-related hospitalizations (to the right of the mark) experienced during the period.

