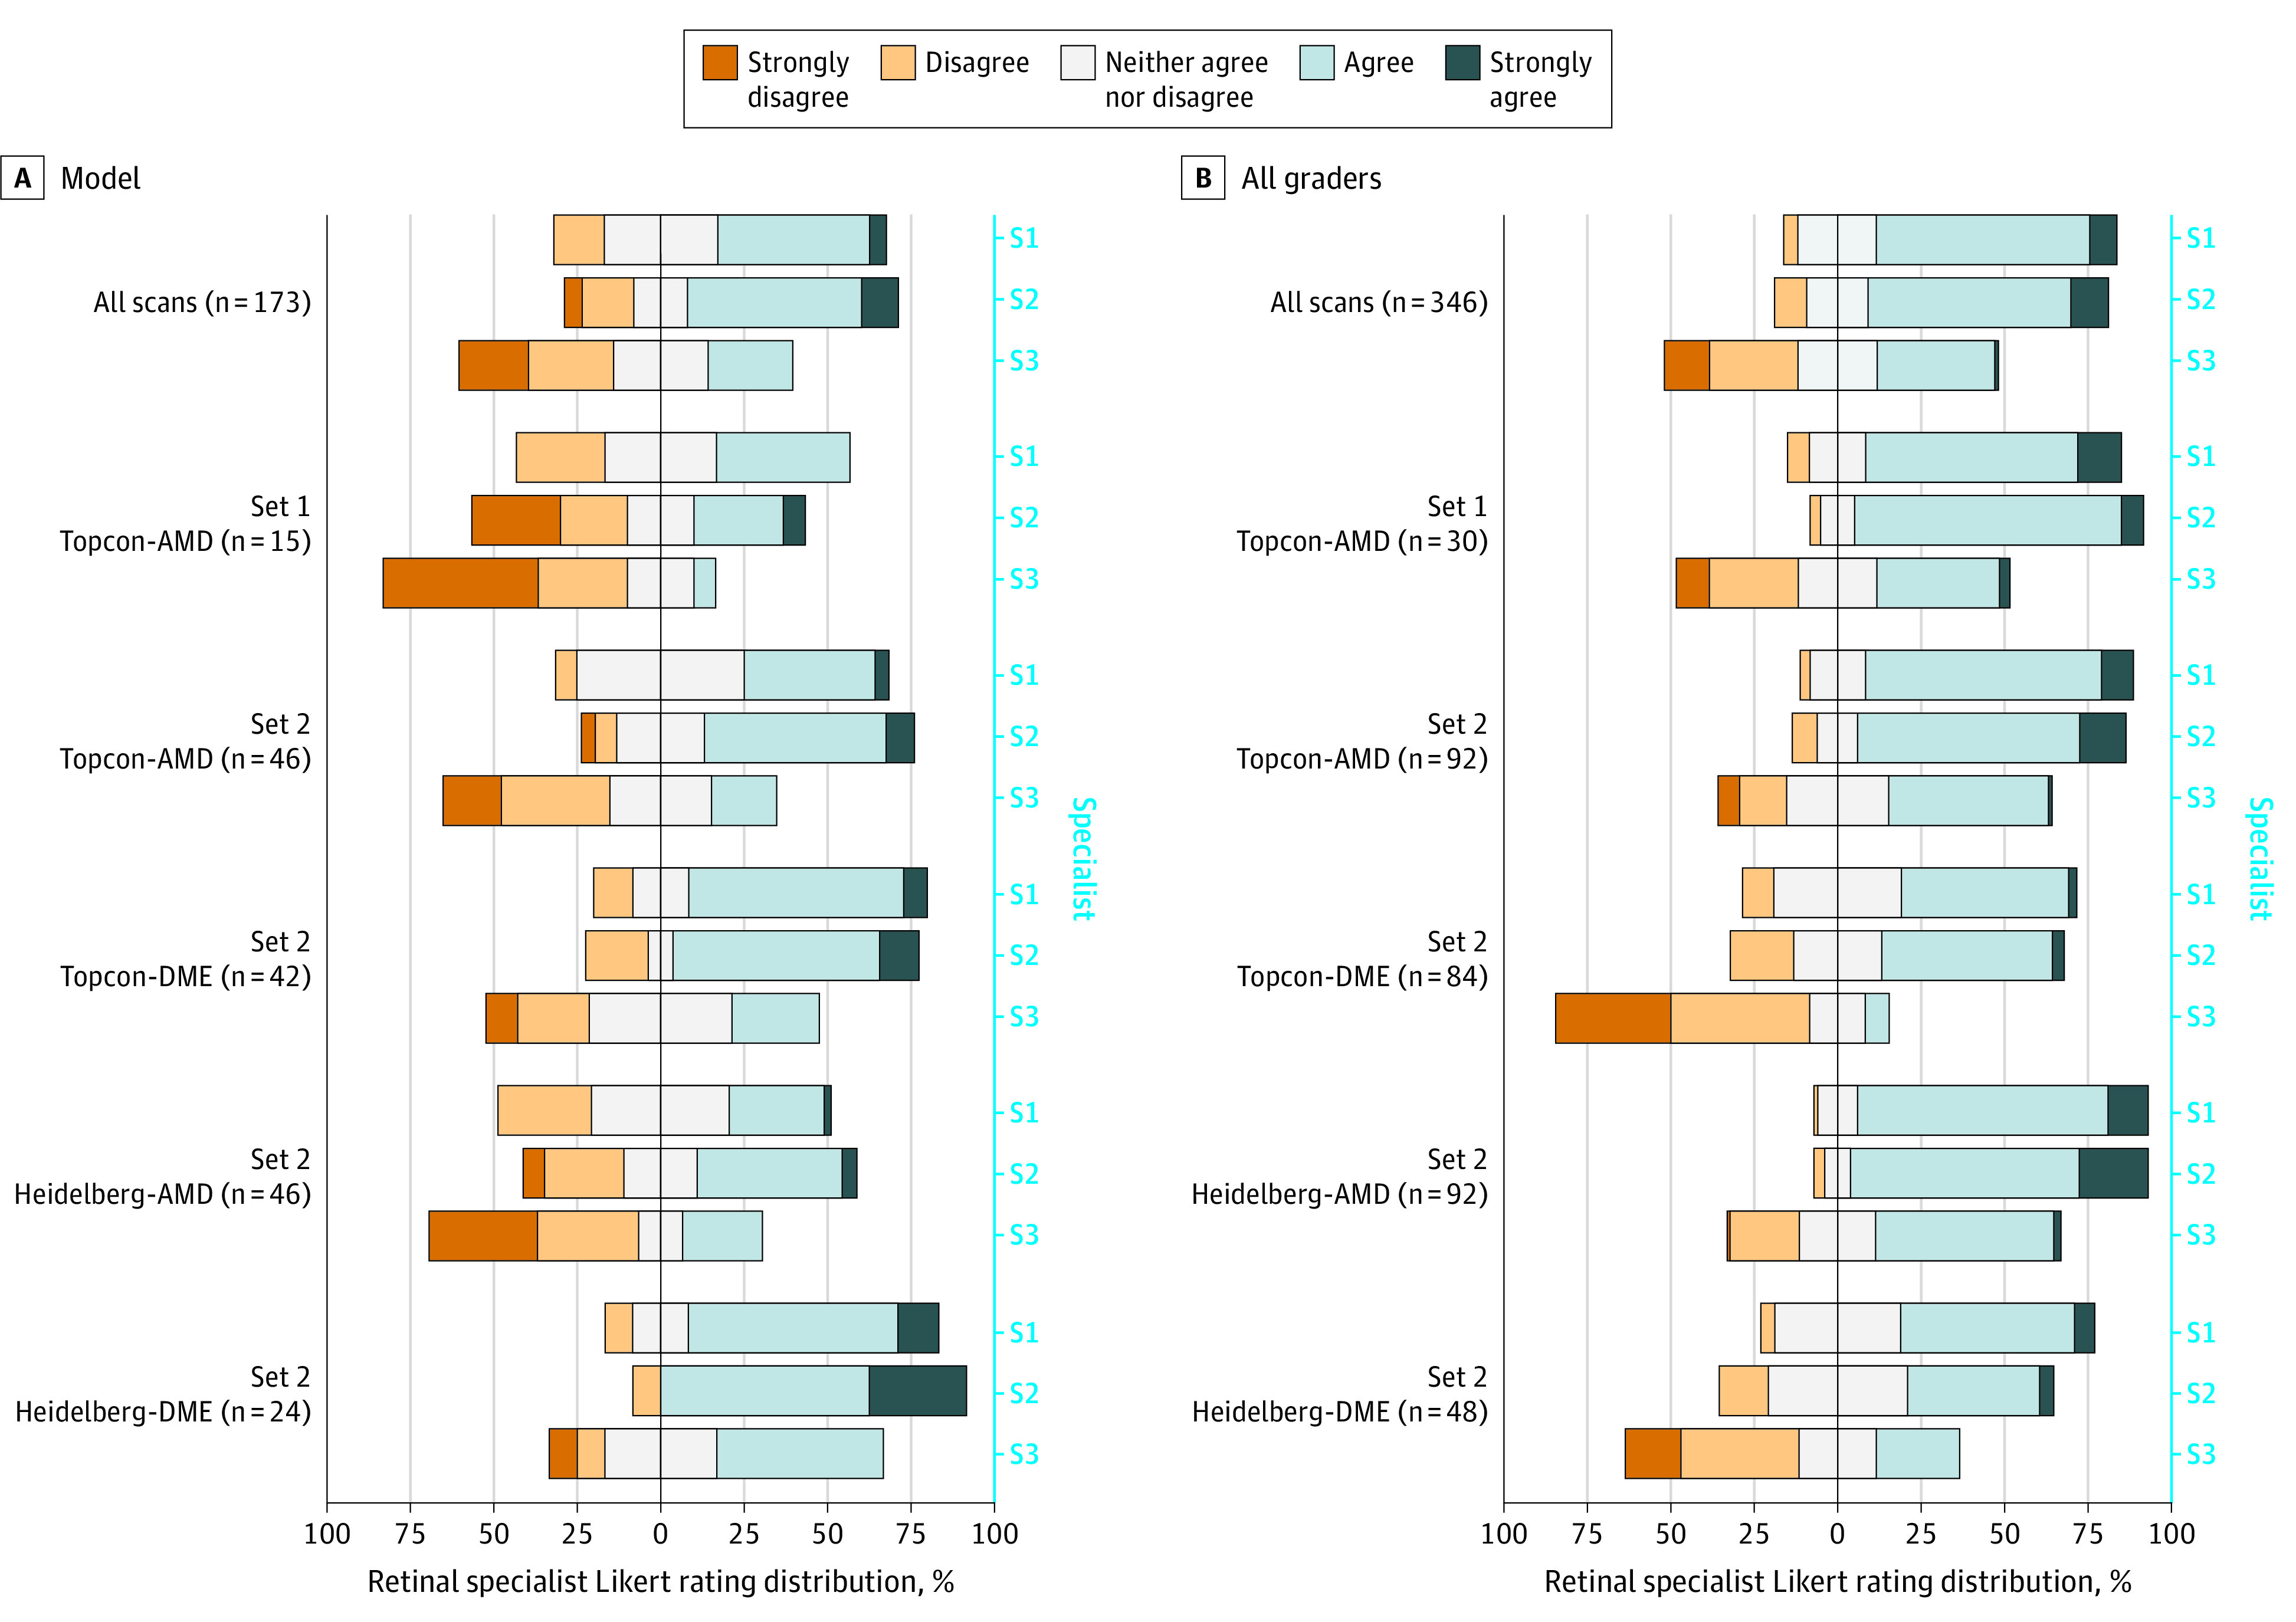
Figure 2. Diverging Stacked Bar Charts Showing Distribution of the Likert Ratings of the Segmentations Given to the Expert Gradings and to the Model.

The distribution is shown for all scans and per subset for the statement “I would be satisfied to use this segmentation within my clinical practice.” Each bar represents ratings given by an individual specialist (S1, S2, and S3). Specialists selected a single point on the Likert scale. The bars are centered on the neutral rating, with negative ratings stacked to the left and positive ratings stacked to the right.
