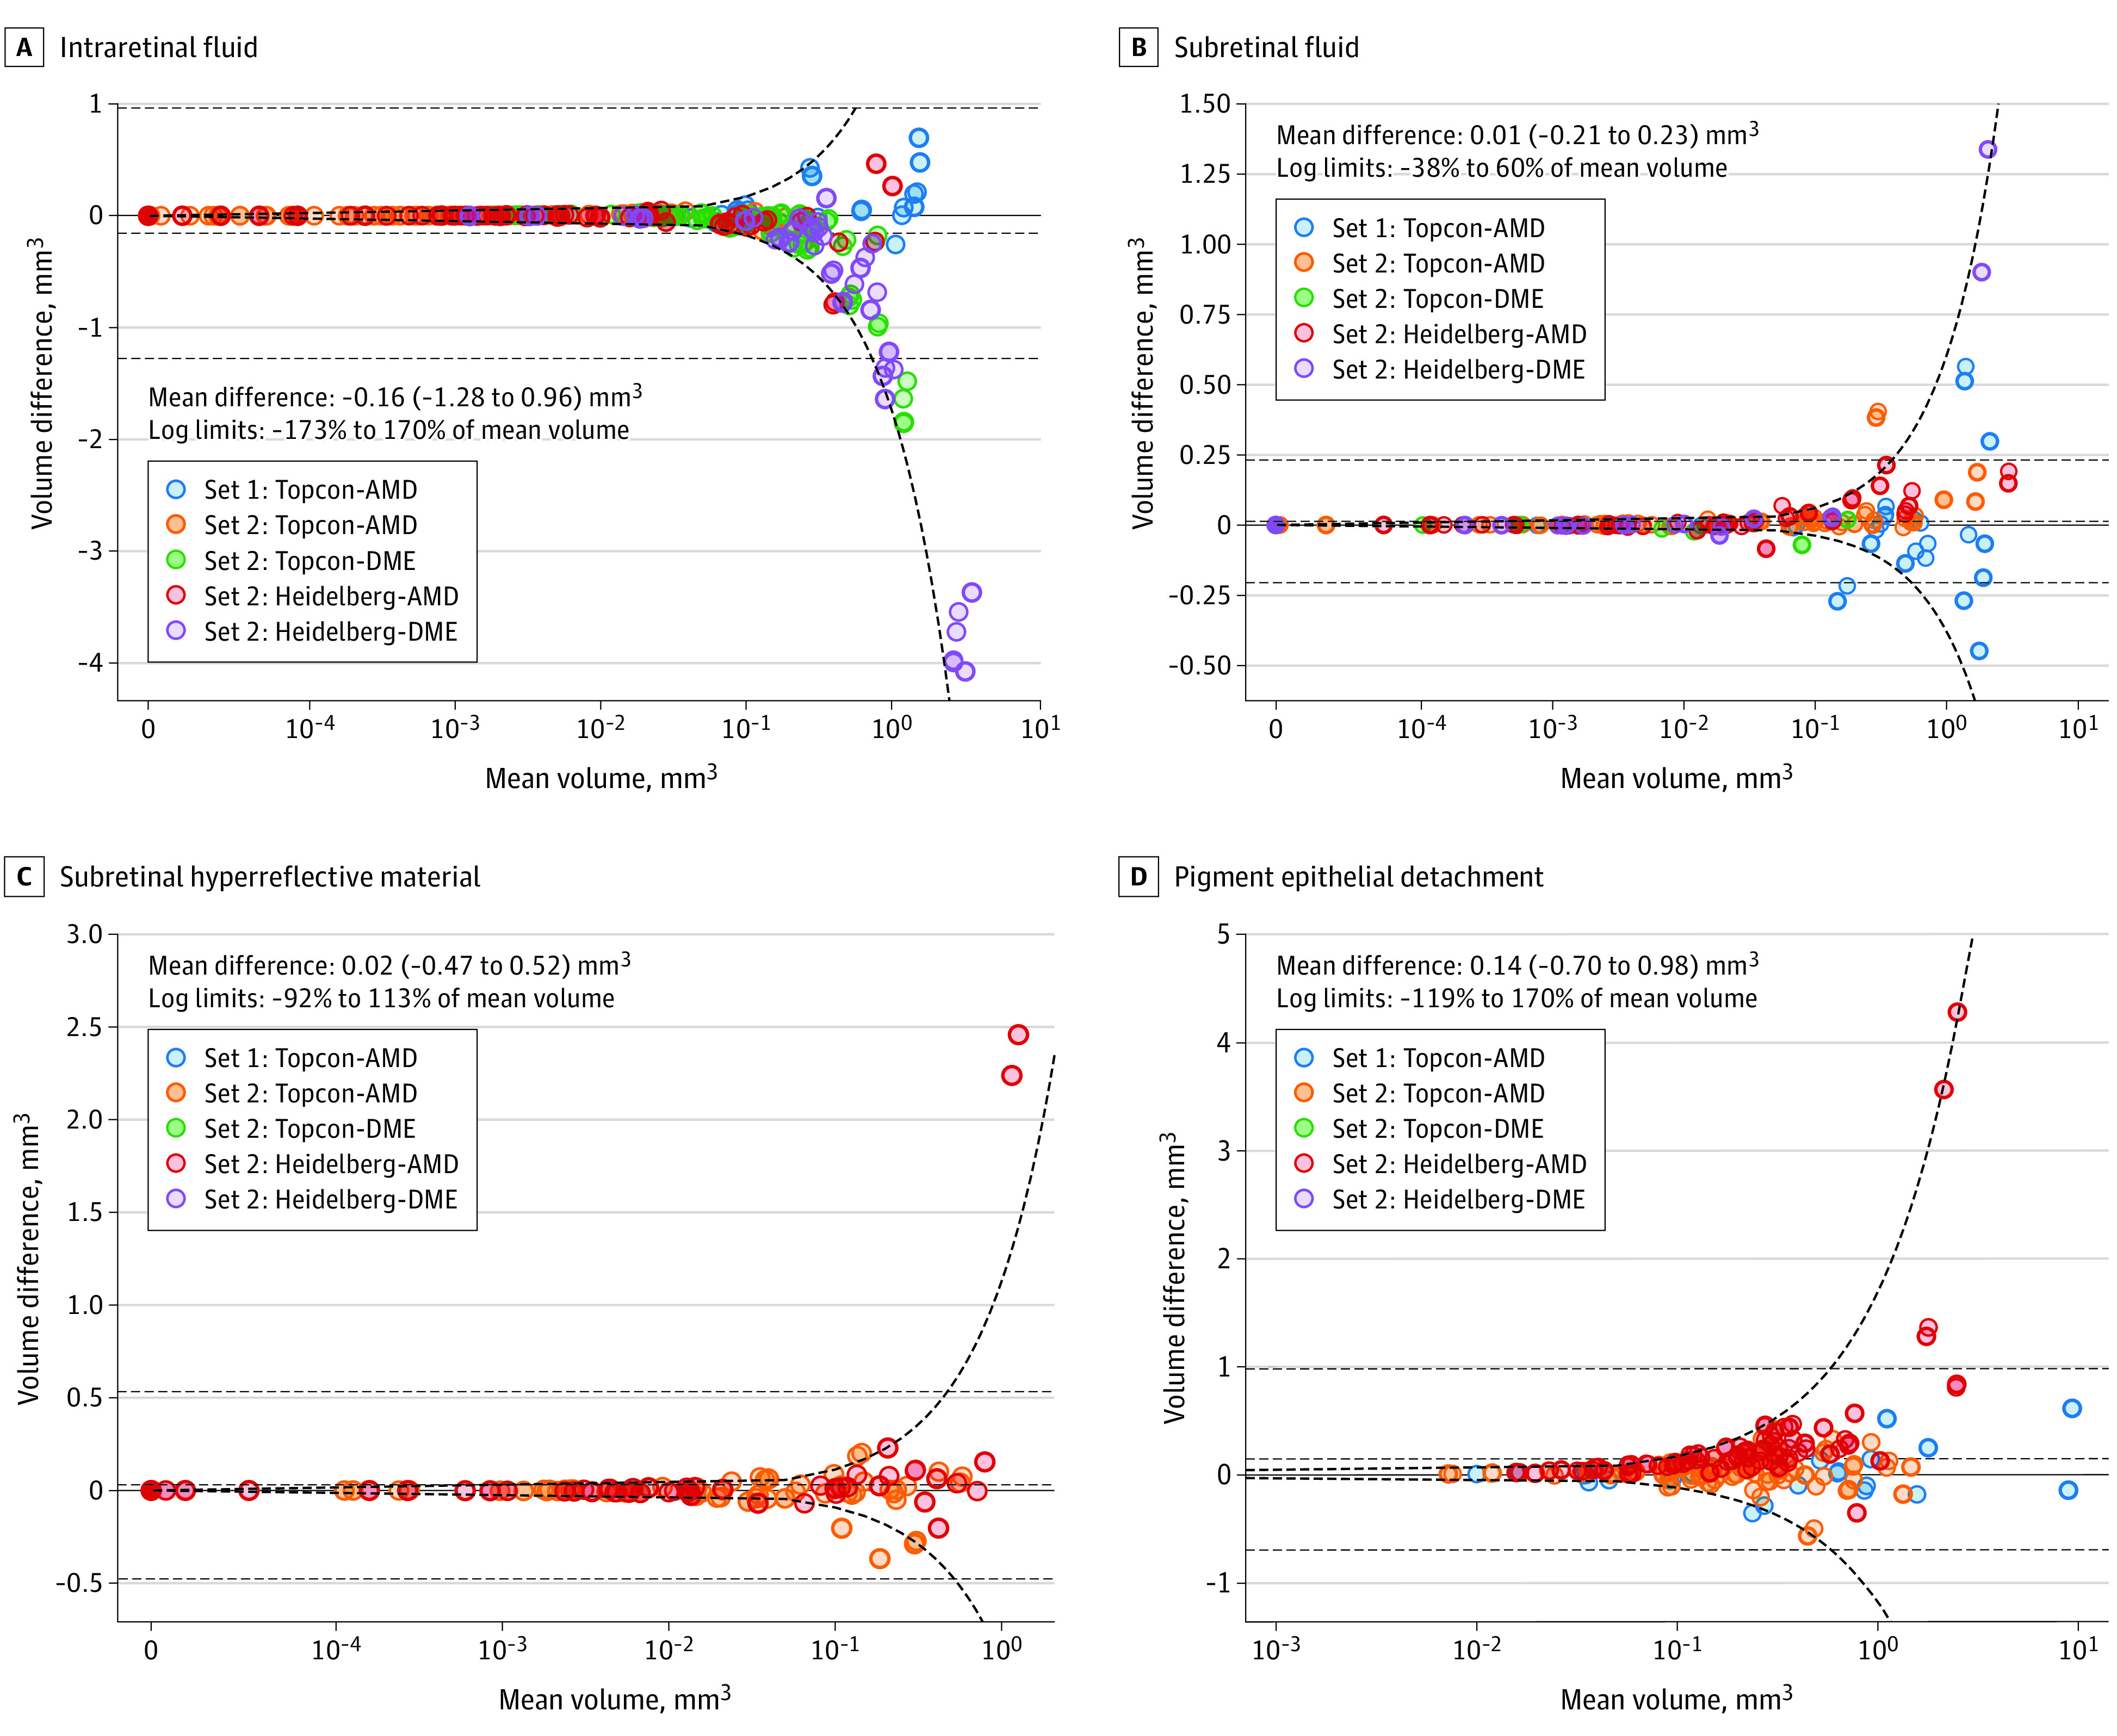
Figure 3. Bland-Altman Plots Comparing Volumes of Individual Features Segmented Between the Model and Grader.

Negative differences on the plots on the right indicate that the model on average segmented greater volumes of the respective feature, whereas positive differences indicate the opposite. The mean value of the difference and the 95% limits of agreement (mean difference ±1.96 SD of the difference) are plotted with black dashed lines. Given that the differences are related to the magnitude of the mean volume, the limits of agreement are also calculated after log-transforming the data and are plotted in the linear space, as a ratio of the mean volume, with bold dashed lines. Optical coherence tomographic (OCT) scans were obtained using the 3D OCT-2000 device from Topcon Corporation (Topcon) and the Spectralis device from Heidelberg Engineering GmbH (Heidelberg) for wet age-related macular degeneration (AMD) and diabetic macular edema (DME).
