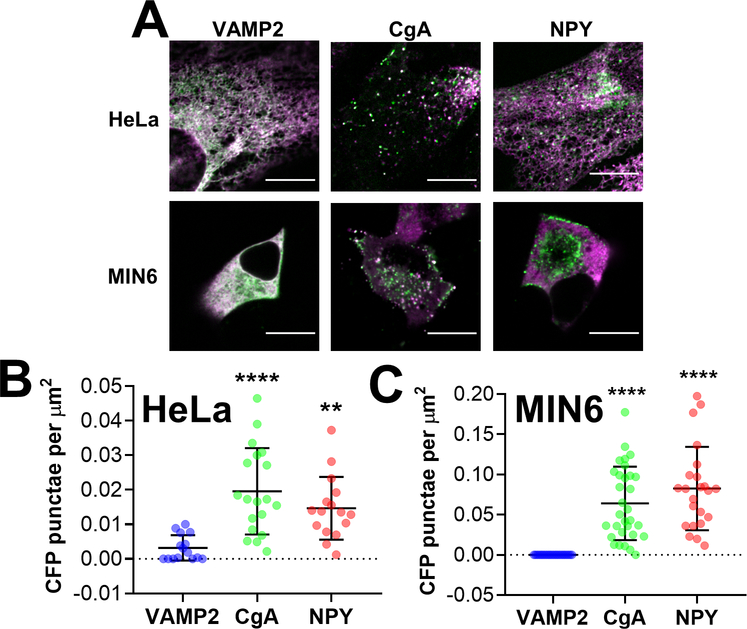
Figure 2: Targeting domains derived from vesicular cargo proteins fused with ZapCY1 accumulate in vesicular puncta in HeLa cells and MIN6 cells.
(A) Representative images of HeLa cells (top row) and MIN6 cells (bottom row) expressing VAMP2-ZapCY1, CgA-ZapCY1 and NPY-ZapCY1 that were collected using a spinning disk microscope. The images shown are an overlay of the CFP channel (green) and YFP channel (magenta). Scale bar = 10 μm. (B) Dot plot of CFP puncta detected per HeLa cell, normalized to cell area (μm2). Three independent experiments were performed per construct, and the average ± standard deviation is shown for n=15 cells (VAMP2), n=19 cells (CgA) and n=16 cells (NPY). Two outliers were identified in the VAMP2 group using the ROUT method (Q=1%) and removed from further analysis. (C) Dot plot of CFP puncta detected per MIN6 cell, normalized to cell area (μm2). Three independent experiments were performed per construct, and the average ± standard deviation is shown for n=22 cells (VAMP2), n=31 cells (CgA) and n=23 cells (NPY). Four outliers were identified in the VAMP2 group using the ROUT method (Q=1%) and removed from further analysis. Statistical analysis for B and C was performed using a One-Way ANOVA test with post hoc Tukey (**** P < 0.0001, ** P < 0.01 compared with VAMP2).

