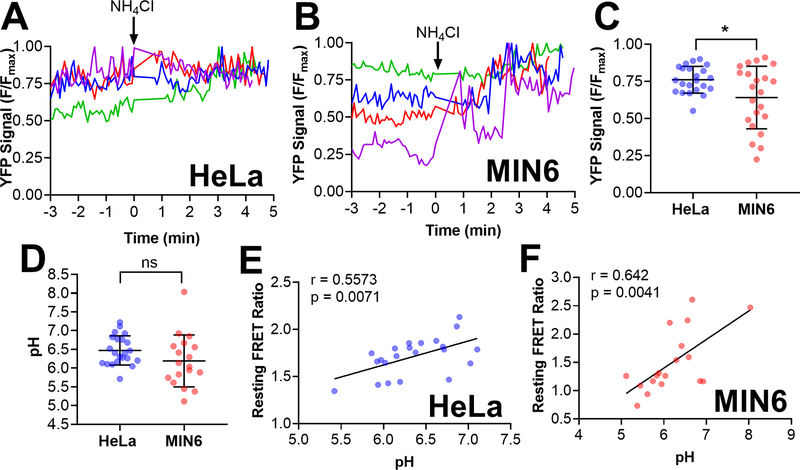
Figure 5: Quantification of pH levels in individual vesicles using CgA-Zn2+ FRET sensor reveals a positive correlation between the resting FRET ratio and pH levels.
HeLa and MIN6 cells expressing CgA-ZapCY1 were imaged using a spinning disk confocal microscope, and individual vesicles were identified and tracked over the course of each experiment. (A) Four representative traces of the normalized YFP signal (F/Fmax) in individual secretory vesicles expressing CgA-ZapCY1 in HeLa cells. To achieve the maximum YFP signal (Fmax), 20 mM NH4Cl (pH 8.5) was added at t = 0 min. (B) Four representative traces of YFP F/Fmax in individual secretory vesicles expressing CgA-ZapCY1 in MIN6 cells. To achieve the maximum YFP signal (Fmax), 20 mM NH4Cl (pH 8.5) was added at t = 0 min. For panels A and B, NH4Cl addition was time-adjusted such that it occurred at t = 0 minutes. (C) Dot plot of YFP F/Fmax prior to NH4Cl addition in individual secretory vesicles expressing CgA-ZapCY1 in HeLa cells (n=22 vesicles) and MIN6 cells (n=22 vesicles). Statistical analysis was performed using an unpaired t-test (*, P < 0.05). (D) Dot plot of resting pH levels in individual secretory vesicles expressing CgA-ZapCY1 in HeLa cells (n=22 vesicles) and MIN6 cells (n=18 vesicles). YFP F/Fmax values were converted to pH using the pH titration curves provided in Figure S-8. Statistical analysis was performed using an unpaired t-test (ns = not significant). (E) Scatter plot showing the linear relationship between resting FRET ratio and pH in HeLa cells (n=22 vesicles). Points were fit with linear regression, and the Pearson correlation coefficient (r) was used to determine whether a correlation exists (p < 0.05 is considered significant). (F) Scatter plot showing the linear relationship between resting FRET ratio and pH in MIN6 cells (n=18 vesicles).

