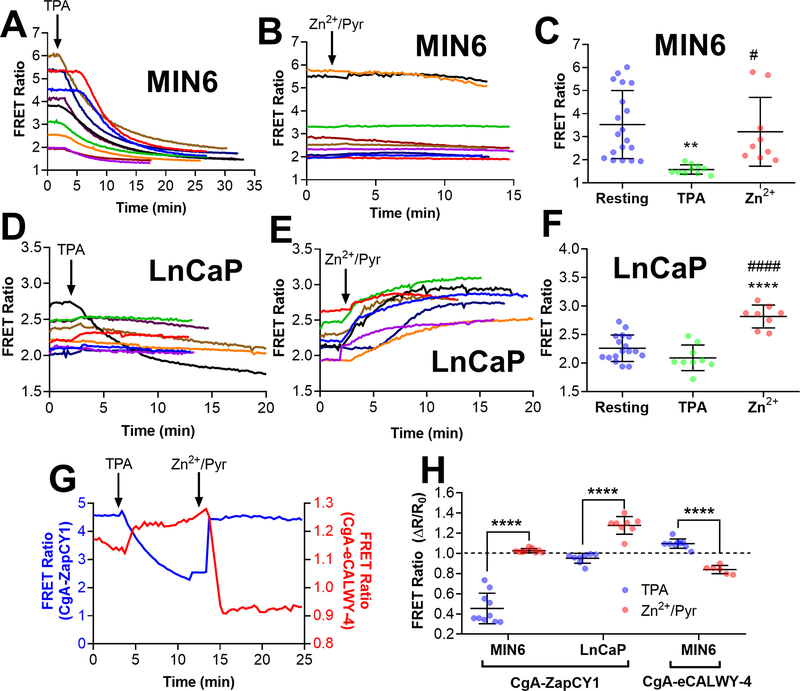
Figure 6: Imaging vesicle populations with CgA-targeted Zn2+ FRET sensors reveals different vesicular Zn2+ environments in MIN6 cells and LnCaP cells.
(A) Time-lapse of FRET ratio in single MIN6 cells expressing CgA-ZapCY1 following the addition of 150 μM TPA (n=10 cells). (B) Time-lapse of FRET ratio in single MIN6 cells expressing CgA-ZapCY1 following the addition of 10 μM ZnCl2 + 5 μM pyrithione + 0.001% saponin (n=9 cells). (C) Dot plot displaying the FRET ratio of single MIN6 cells expressing CgA-ZapCY1 under three conditions: the resting FRET ratio prior to drug addition (resting), the minimum FRET ratio following TPA addition (TPA) and the maximum FRET ratio following Zn2+ addition (Zn2+). At least three independent experiments were performed per condition, and the average ± standard deviation is shown for n=19 cells (resting), n=10 cells (TPA) and n=9 cells (Zn2+). Statistical analysis was performed using a One-Way ANOVA test with post hoc Tukey (**, P < 0.01 compared with resting; #, P < 0.05 compared with TPA).(D) Time-lapse of FRET ratio in single LnCaP cells expressing CgA-ZapCY1 following the addition of 150 μM TPA (n=9 cells). (E) Time-lapse of FRET ratio in single LnCaP cells expressing CgA-ZapCY1 following the addition of 10 μM ZnCl2 + 5 μM pyrithione + 0.001% saponin (n=8 cells). (F) Dot plot displaying the FRET ratio of single LnCaP cells expressing CgA-ZapCY1 under resting, TPA and Zn2+ conditions. At least three independent experiments were performed per condition, and the average ± standard deviation is shown for n=17 cells (resting), n=9 cells (TPA) and n=8 cells (Zn2+). Statistical analysis was performed using a One-Way ANOVA test with post hoc Tukey (****, P < 0.0001 compared with resting; ####, P < 0.0001 compared with TPA). (G) Representative trace of full Zn2+ calibration for CgA-ZapCY1 (blue trace) and CgA-eCALWY-4 (red trace) performed in MIN6 cells. The FRET ratios on the left (blue) and right (red) correspond with CgA-ZapCY1 and CgA-eCALWY-4, respectively. (H) Dot plot of ΔR/R values (normalized to baseline of one) of CgA-ZapCY1 in MIN6 cells, CgA-ZapCY1 in LnCaP cells and CgA-eCALWY-4 in MIN6 cells. For each sensor/cell line combination, ΔR/R was compared between the TPA and Zn2+/Pyr treatments using an unpaired t-test (****, P < 0.0001).

