Figure 1.
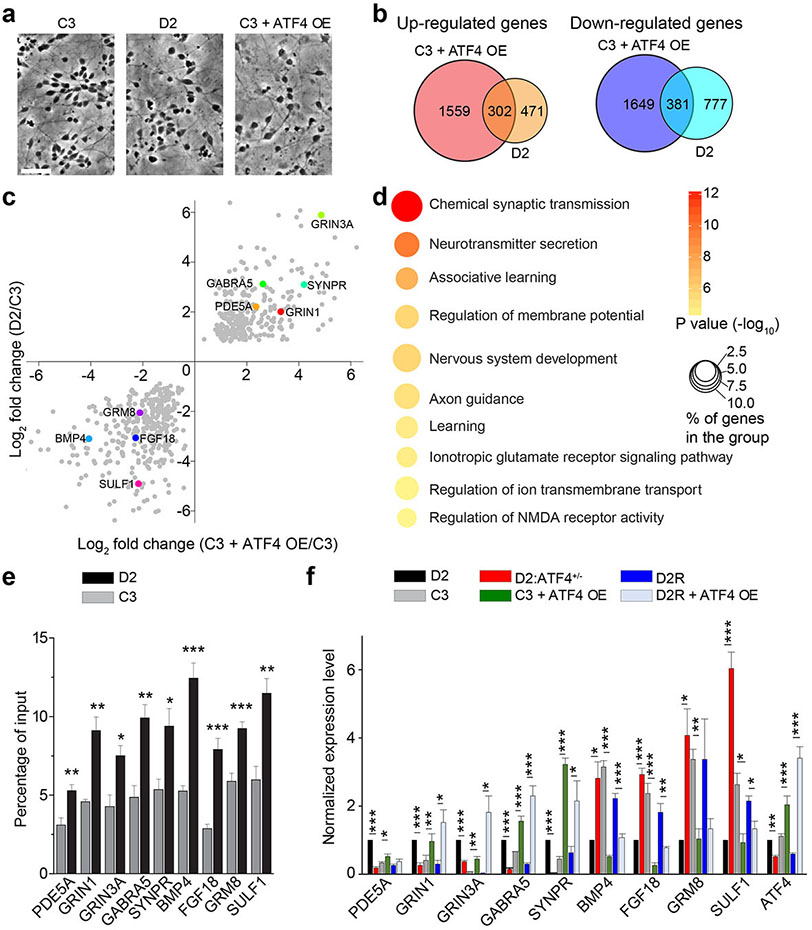
ATF4 directly regulates the expression of a large set of dysregulated genes in DISC1 mutant human neurons. (a) Sample images of neurons derived from different iPSC lines. Scale bar, 50 μm. (b) Venn diagrams showing significant overlap of dysregulated genes in control neurons with ATF4 overexpression (C3+ATF4 OE) and in D2 cortical neurons. (c) Scatter plot of commonly dysregulated genes in C3+ATF4 OE and D2 neurons. Highlighted in different colors are genes subjected to further validation and investigation. (d) GO analysis of 302 commonly up-regulated genes in C3+ATF4 OE and D2 neurons. Bubble plot showing enrichment for biological process terms related to synaptic function. Size and color of the bubble represent the proportion of commonly dysregulated genes enriched in each pathway (%) and the significance of enrichment, respectively. (e) ChIP-qPCR analysis of ATF4 binding at the promoter regions of indicated genes in C3 and D2 neurons, note the enhanced binding of ATF4 to these gene promoters in D2 neurons. Values represent mean ± s.e.m. (n = 3, *p < 0.05, **p < 0.01, ***p < 0.001, t-test). (f) Relative mRNA expression of commonly dysregulated genes in D2, C3, D2:ATF4+/−, C3+ATF4 OE, D2R, and D2R+ATF4 OE cortical neurons. Values represent mean ± s.e.m. (n = 3, *p < 0.05, **p < 0.01, ***p<0.001, t-test).

