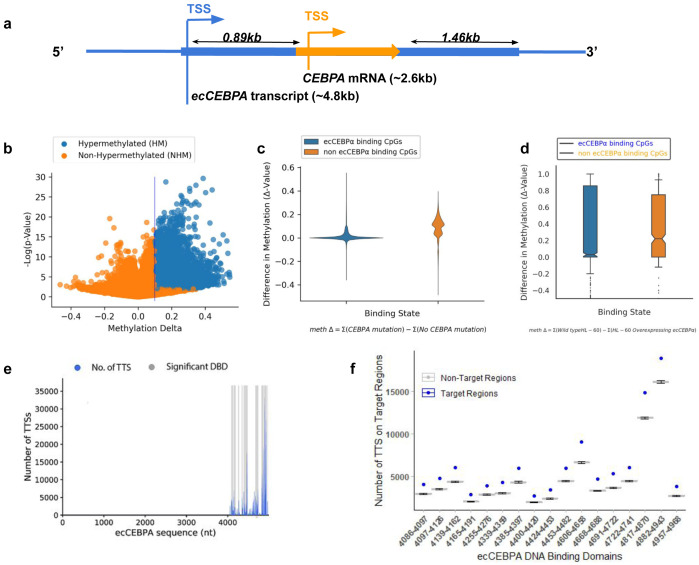
Figure 1.
( a) Schematic diagram for transcriptional products in the CEBPα locus; CEBPα is represented by an orange arrow and ecCEBPα is represented by the blue line. ( b) Global change in DNA methylation. ( c) Difference in DNA methylation levels between patients with and without CEBPα mutation in the regions of ecCEBPα predicted binding (non parametric t-test, p-value >1E-10). ( d) Number of DNA Triplex Target Site (y-axis) and a location of the corresponding TFO on the ecCEBPα (TFO: RNA; x-axis). ( e) Number of Triplex Target sites per TFO predicted for NHM and HM CpG regions.

