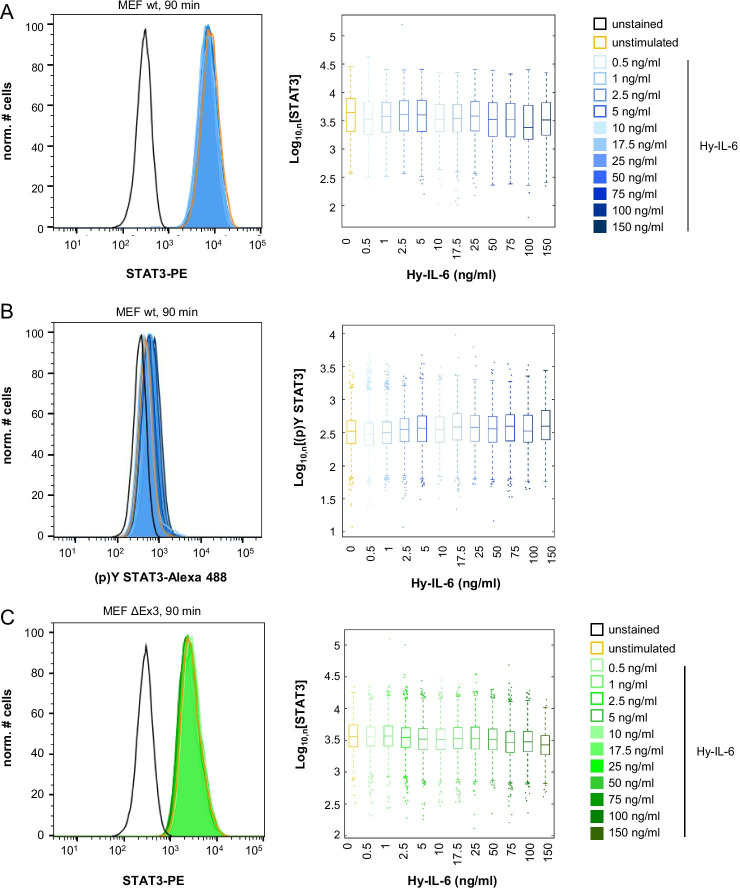
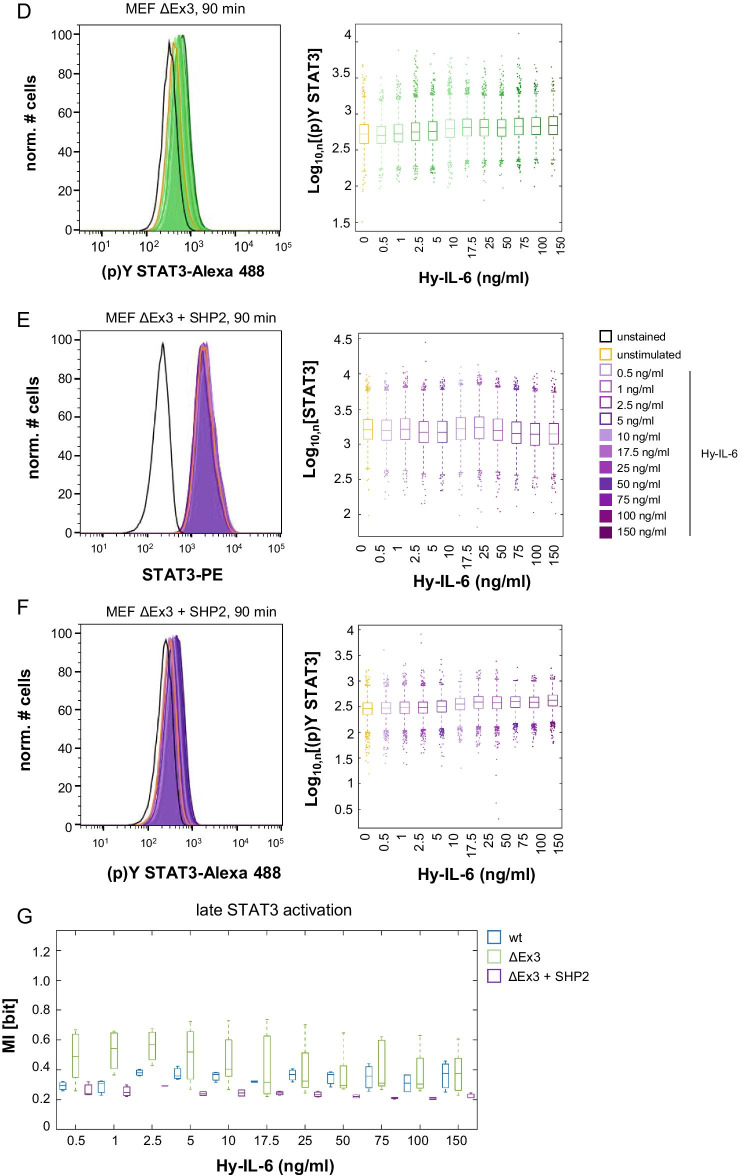
Fig. 4.
SHP2 does not influence robustness of late IL-6-induced STAT3 phosphorylation. a, b MEF wt cells c, d MEF ΔEx3 cells e, f MEF ΔEx3 + SHP2 cells were stimulated with increasing amounts of Hy-IL-6 for 90 min. STAT3 expression and phosphorylation were evaluated by intracellular multiplex flow cytometry using specific fluorescent antibodies against STAT3 (A, C, E) and STAT3-Y705 phosphorylation (B, D, F). Representative histograms of n = 3 independent experiments are shown. For independent experiments mean fluorescence of cells for each cytokine dose was calculated. Maximal mean fluorescence was normalised to 100%. Log10 normalised data points are given as boxplots with median and IQR (box). For better visualisation, only ~ 5% of all data points (n = 1000) per concentration from 3 independent experiments were randomly selected for display. g Based on the data presented in Fig. 4 A-F Mutual Information between STAT3 expression and Hy-IL-6-induced STAT3-Y705 phosphorylation in MEF cells (blue), in MEF SHP2 ΔEx3 cells (green), and MEF SHP2 ΔEx3 + SHP2 cells (violet) stimulated with the indicated amount of Hy-IL-6 for 90 min was calculated. Data are from n = 3 - 6 independent experiments. Statistics: no significant differences were observed for p-value < 0.05 (Anova) and d > 0.2 (complete statistics for Fig. 4 in Additional file 3: Table 2)


