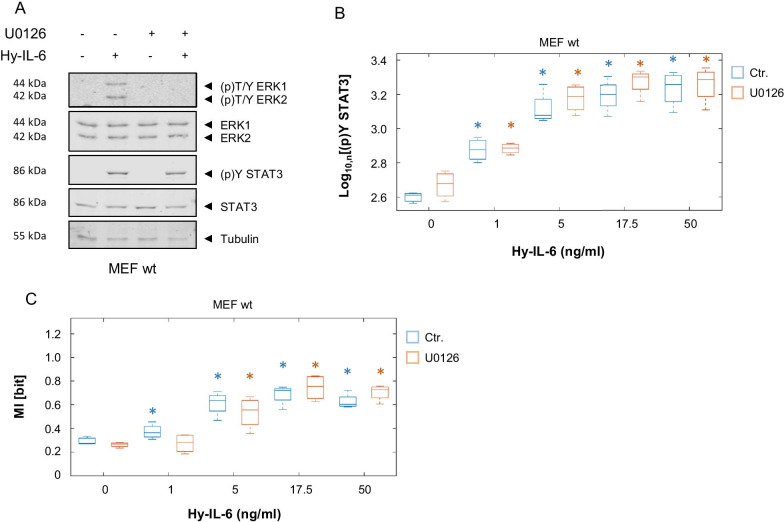
Fig. 5.
MAPK does not contribute to robustness of IL-6-induced JAK/STAT signalling. a MEF wt cells were pre-treated with U0126 (10 µM) for 20 min or left untreated and subsequently stimulated with Hy-IL-6 (20 ng/ml) for 15 min. ERK1/2 and STAT3 phosphorylation and ERK1/2, STAT3, and Tubulin expression were evaluated by Western Blotting. A representative result of n = 3 experiments is shown. b MEF wt cells were pre-treated with U0126 (10 µM) for 20 min and subsequently stimulated with the indicated amounts of Hy-IL-6 for 15 min. STAT3 expression and phosphorylation were evaluated by intracellular multiplex flow cytometry using specific fluorescent antibodies against STAT3 and STAT3-Y705 phosphorylation. Mean STAT3 phosphorylation of n = 3 - 4 experiments are shown as boxplots with median and IQR (box). Statistics: no significant differences between control and U0126-treated cells were observed for p-value < 0.05 (Anova) and d > 0.2; stars indicate a significant increase of Hy-IL-6-induced (p)Y STAT3 compared to (p)Y STAT3 in unstimulated cells within each condition: blue * (Ctr.), orange * (U0126), p-value < 0.05 (Anova) and d > 0.2 (complete statistics for Fig. 5b in Additional file 4: Table 3) c Based on the multiplexed flow cytometry data Mutual Information between STAT3 expression and Hy-IL-6-induced STAT3-Y705 phosphorylation was calculated. Data are from n = 3 - 4 independent experiments. Statistics: no significant differences between control and U0126-treated cells were observed for p-value < 0.05 (Anova) and d > 0.2; stars indicate a significant increase of MI in Hy-IL-6-treated cells compared to MI in unstimulated cells within each condition: blue * (Ctr.), orange * (U0126), p-value < 0.05 (Anova) and d > 0.2 (complete statistics for Fig. 5 in Additional file 5: Table 4)

