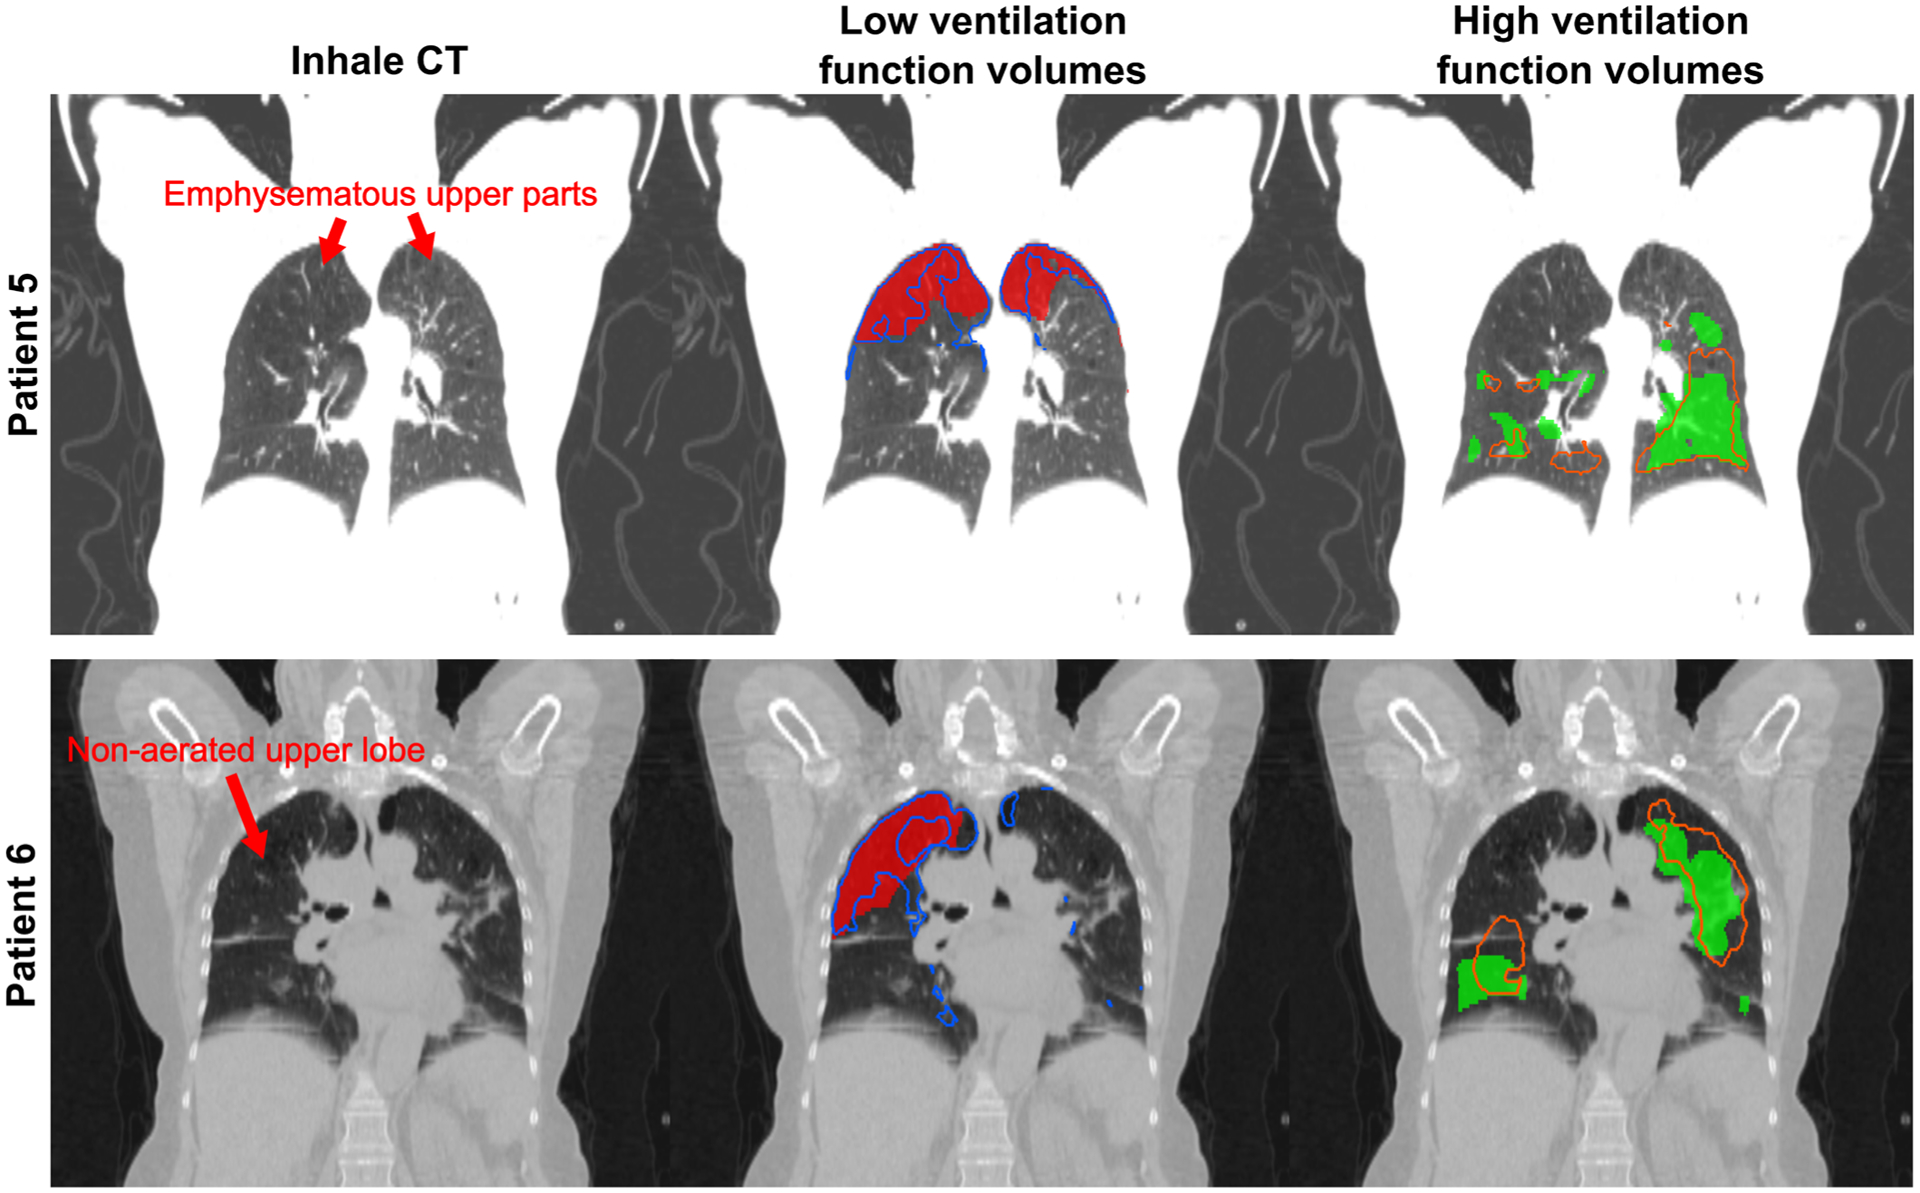
FIG. 5.

Representation for the two patients presenting the highest correlation between stress maps and reference SPECT-V images of the low and high function volumes obtained by thresholding. The plain red and green area represent respectively the low and high function volumes derived from the SPECT-V. The blue and orange contours represent the same volumes but derived from the stress maps.
