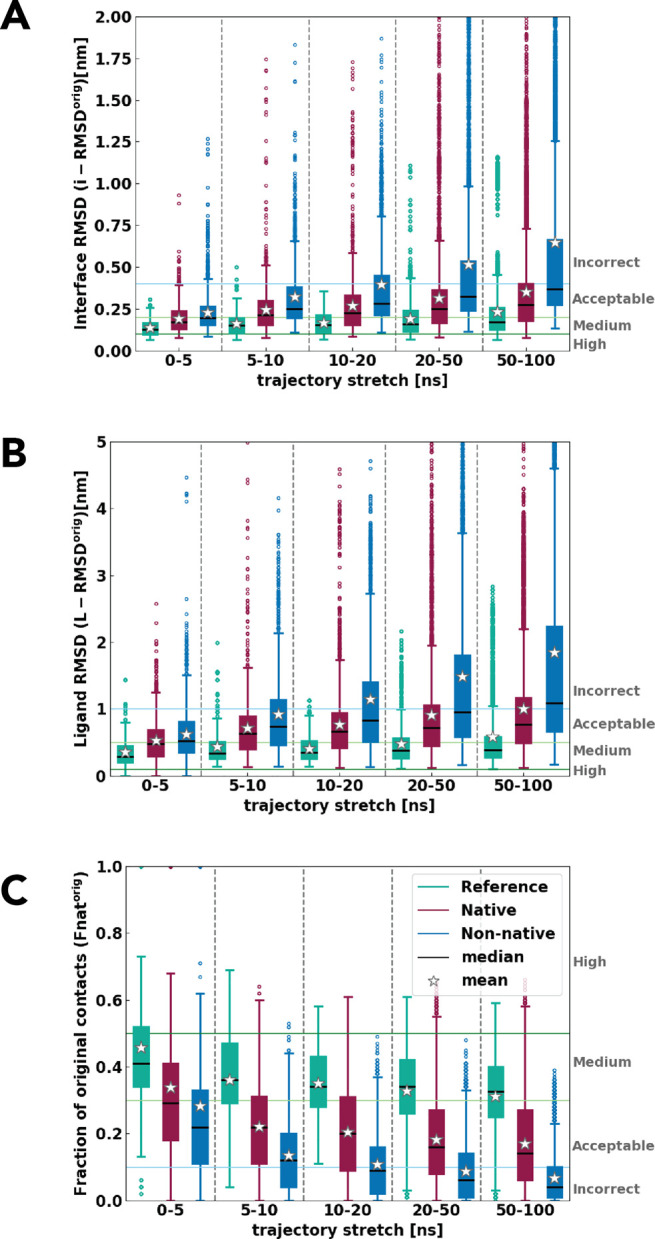
Figure 2.

(A) Interface-RMSDorig, (B) ligand-RMSDorig, and (C) fraction of native contacts (Fnatorig) for native, non-native, and reference crystal structures with respect to the beginning of the trajectory for all 20 complexes. The boxplot shows the interquartile range with its median as black lines, mean as stars, and whiskers and outliers in circles. Reference in teal, native clusters in burgundy, and non-native in blue.
