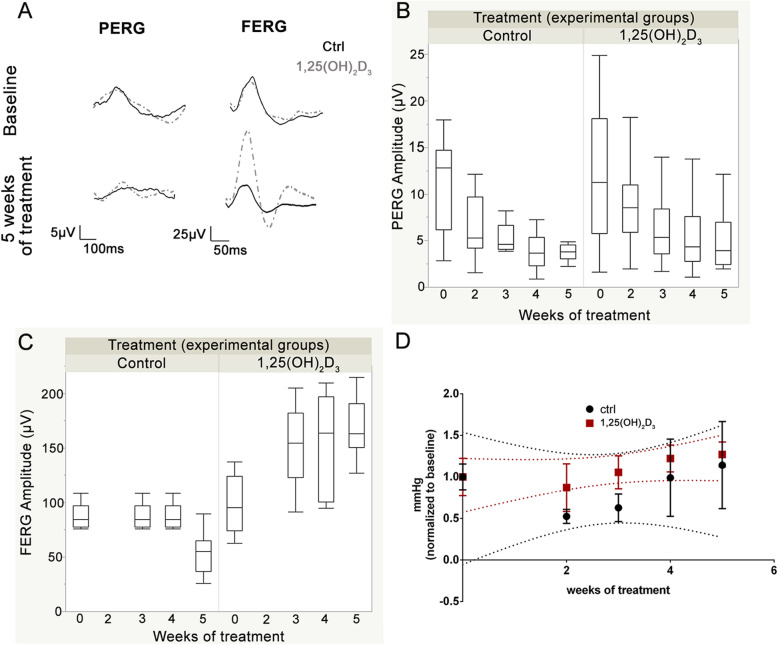
Fig. 2.
Evaluation of the effects of 1,25(OH)2D3 treatment on PERG, FERG, and IOP. A Representative waveforms of PERG and FERG at baseline and at the end of treatment. Each waveform, deriving from PERG and FERG recordings, was analysed for the peak-to-trough amplitude. B (PERG) and C (FERG) report the plot of amplitude values vs. time of treatment, as regards control DBA/2J and 1,25(OH)2D3-treated mice. PERG was recorded at baseline and from the 2nd to the 5th week of treatment; FERG was recorded at baseline and from the 3rd week of treatment. D IOP values normalized to baseline data, over time. Data were analysed using the GEE statistics to test the effects of time and of treatment; n = 30 independent records per experimental group, two eyes per mouse, 15 mice per group.

