Fig. 6.
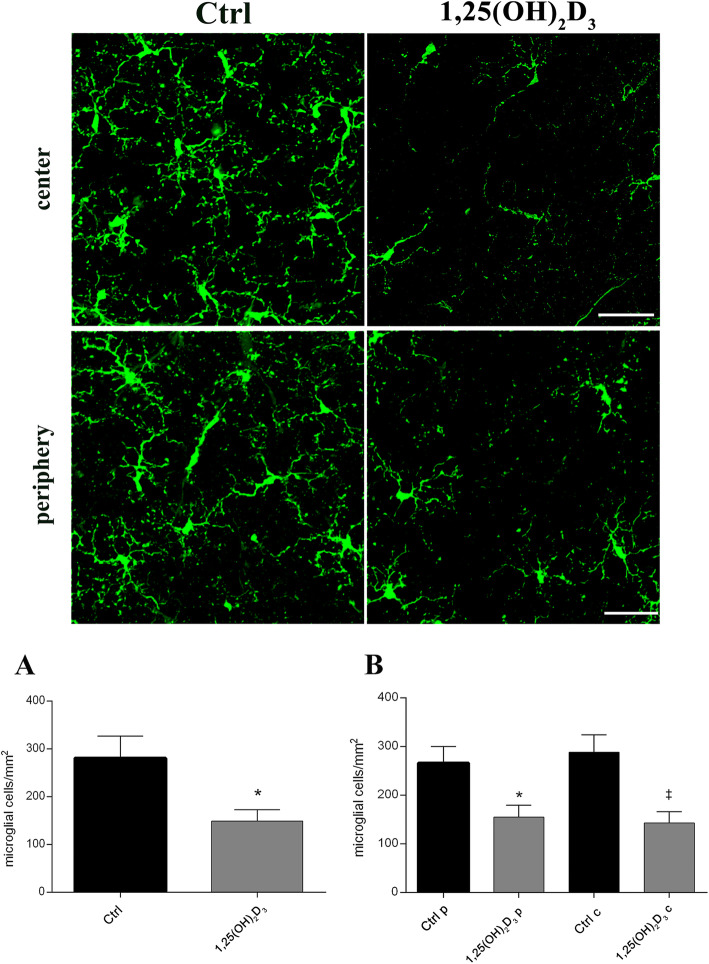
Microglial activation in DBA/2J retina was inhibited after 1,25(OH)2D3 treatment. Upper panel shows representative images of microglial activation evaluated by immunohistochemistry with the Iba-1 marker in control (vehicle-treated) and 1,25(OH)2D3-treated groups. Scale bar, 50 μm. The density of activated microglial cells was calculated by counting the number of Iba-1+ cells normalized to the scanned area. The quantification was carried out on whole retina (A), on both retinal centre and periphery (B). Data are plotted as mean ± SD (n = 6 flat-mount retinas for each experimental group, n = 48 images for each experimental group): A *p = 0.0400 vs. Ctrl, t-test two-tailed. B *p = 0.0186 vs. Ctrl periphery (Ctrl p) ‡p = 0.0186 vs. Ctrl centre (Ctrl c), one-way ANOVA with Tukey post hoc test for multiple comparison

