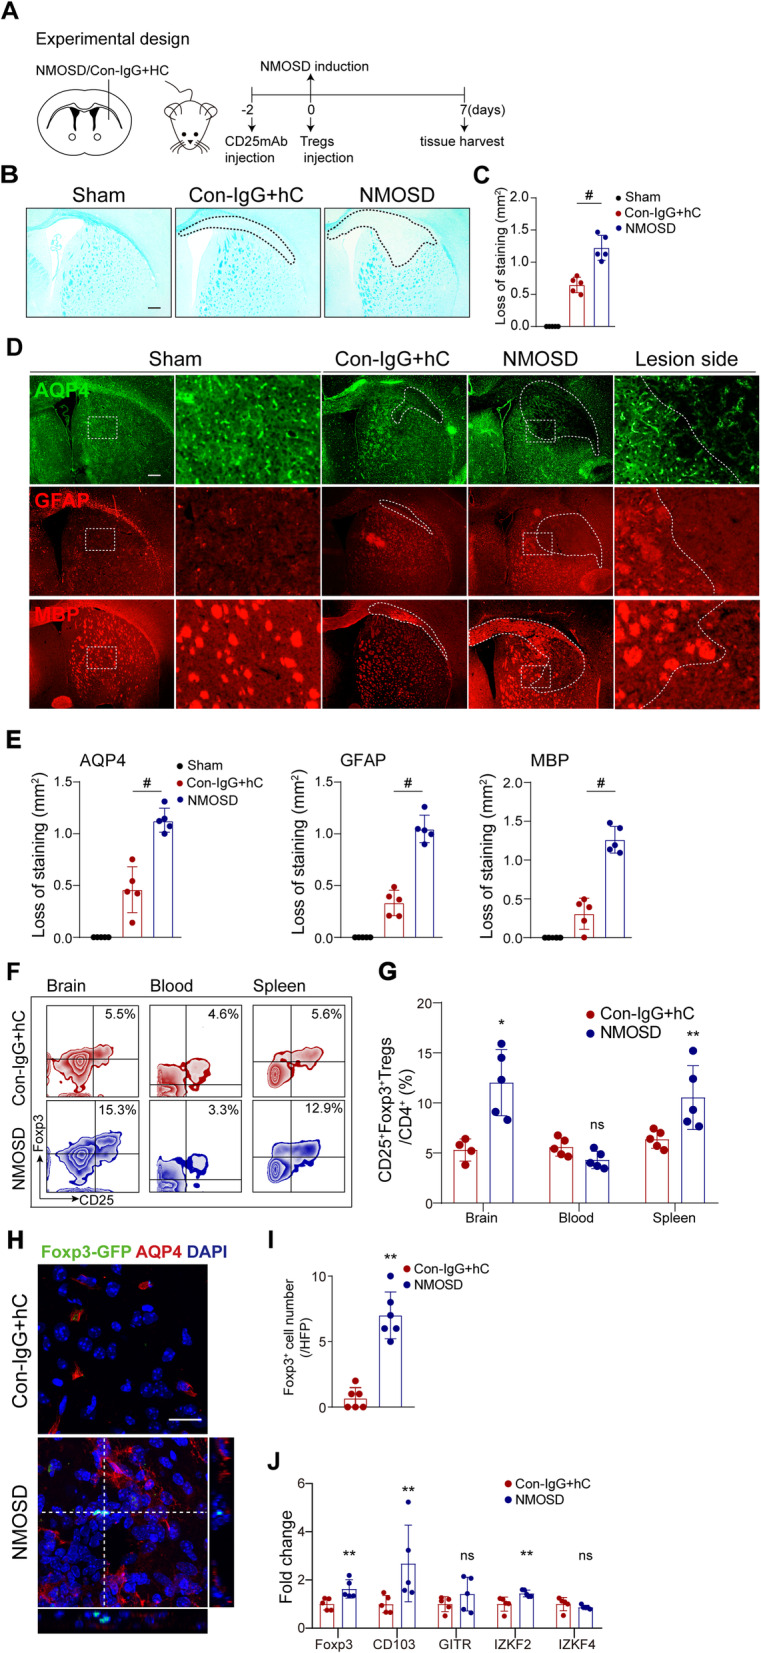
Fig. 2.

Tregs accumulated in the NMOSD-IgG and human complement-mediated brain lesion. A Schematic of experimental setup in mouse model of NMOSD. B Mice brains were injected with 6 μL NMOSD-IgG and 4 μL hC (NMOSD group) or Con-IgG and 4 μL hC (Con-IgG + hC). The demyelinated area was assessed by LFB staining 7 days post-injury. Scale bar, 300 μm. C Quantification of lesion size. Results displayed as mean and SD. n = 5 per group. #p < 0.0001 versus Con-IgG + hC group; statistical analyses were performed by one-way analysis of variance followed by Dunnett’s post hoc test. D Representative images of immunofluorescence staining for AQP4, GFAP, and MBP 7 days post-injection. Scale bar, 300 μm. E Quantifications of stained area. n = 5 per group; #p < 0.0001 versus Con-IgG + hC group; statistical analyses were performed by one-way analysis of variance followed by Dunnett’s post hoc test. F Flow cytometry zebra plots depicted percentages of CD4+CD25+Foxp3+ Tregs in the brain, blood, and spleen of representative NMOSD and control mice. G Quantification of Treg frequencies. n = 4–5 per group; *p < 0.05, **p < 0.01, ns, no significance, versus Con-IgG + hC group; statistical analyses were performed by Mann-Whitney U test. H Representative images of Foxp3-EGFP+ cells in brain slices of Foxp3-EGFP/cre mice after NMOSD induction. Scale bar, 20 μm. I Quantification of the number Foxp3-EGFP+ cells. n = 6 per group. **p < 0.01 versus Con-IgG + hC group; statistical analyses were performed by Mann-Whitney U test.
J The mRNA expression of Tregs-related genes: Foxp3, CD103, GITR, IKZF2, and IKZF4 in NMOSD and control mice. n = 5 per group. *p < 0.05, **p < 0.01, ns, no significance, versus Con-IgG + hC group; statistical analyses were performed by two-tailed unpaired t test
