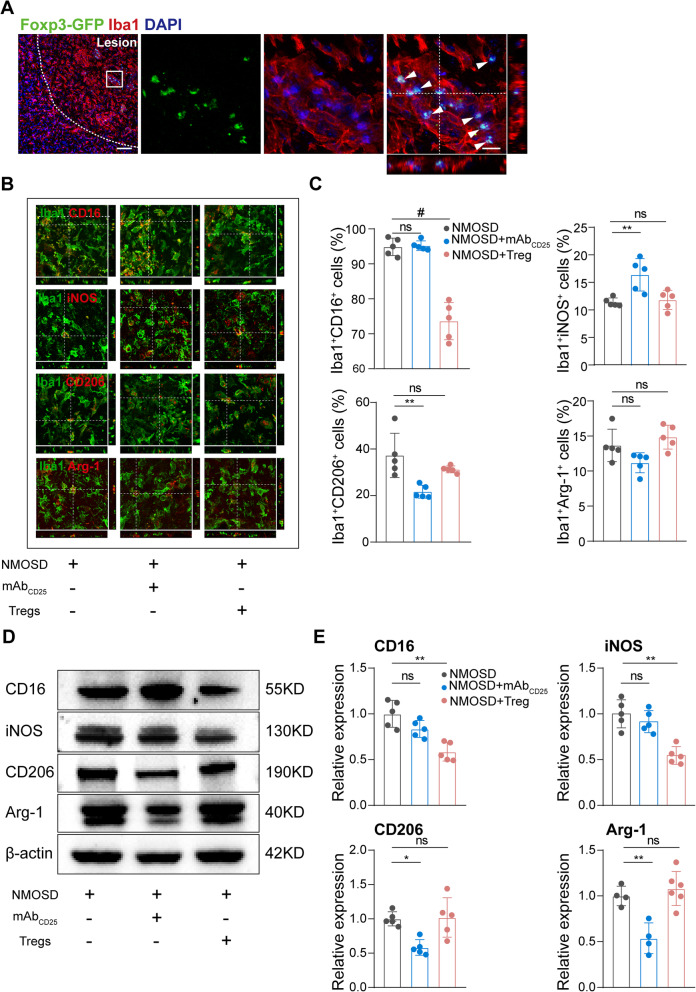
Fig. 5.
Tregs changed macrophages/microglia inflammatory status in NMOSD lesion. A Representative images of Iba1+ and Foxp3-EGFP+ cells in Foxp3-EGFP/cre mice with NMOSD. Scale bar, 80 μm. B Representative images of Iba1, CD16/32, iNOS, CD206, and Arg-1 stating 7 days post-NMOSD induction. Scale bar, 20 μm. C Percentages of CD16/32/iNOS/CD206/Arg-1-positive cells verse total Iba1-positive cells. n = 5 mice for each group. **p < 0.01, #p < 0.0001. ns, no significance, versus NMOSD group; statistical analyses were performed by one-way analysis of variance followed by Dunnett’s post hoc test. D Representative western blots of CD16/32/iNOS/CD206/Arg-1 in lesion samples. E Quantitative analysis of CD16, iNOS, CD206, and Arg-1 relative expression. n = 4–6 mice for each group. *p < 0.05, **p < 0.01. ns, no significance, versus NMOSD group; statistical analyses were performed by one-way analysis of variance followed by Dunnett’s post hoc test

