Figure 2 .

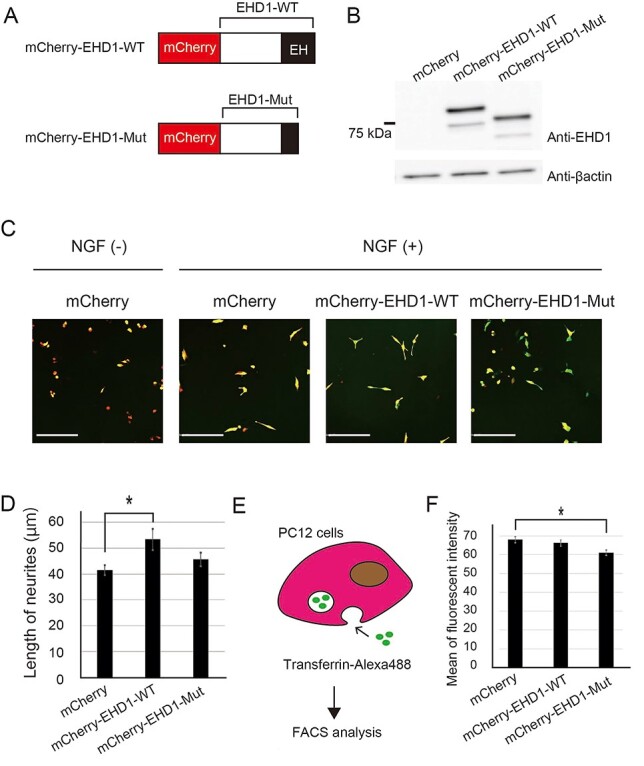
Functional analyses of the de novo LOF mutation in EHD1 in PC12 cells. (A) Diagram of the EHD1 proteins fused with mCherry. (B) Western blot for EHD1 in PC12 cells transfected with the EHD1 expression vectors. (C) Representative fluorescence microscope images of PC12 cells stimulated with β-NGF. mCherry-EHD1-(red) and Venus-(green) expression vectors were co-transfected into PC12 cells. The images of Venus were utilized for the analysis of the neurite length. Scale bars, 200 μm. (D) Neurite length. mCherry-EHD1-WT-expressing PC12 cells showed significantly longer neurites. n > 81 cells. Data shown are the mean ± standard error of the mean (SEM). Tukey’s multiple test was used for multiple comparisons. *P < 0.05. Effect size, η2 = 0.027. (E) Schematic diagram of quantification of endocytosis. The uptake of Alexa Fluor 488-conjugated transferrin by starved PC12 cells was measured using FACS. (F) The mean of Alexa Fluor 488 fluorescent intensity measured by FACS. The fluorescent intensity was the average of Alexa Fluor 488 of mCherry positive cells. Transferrin uptake was significantly lower in mCherry-EHD1-Mut-expressing PC12 cells compared with mCherry-expressing cells. The trial was triplicated (n = 3). Data shown are the mean ± SEM. Tukey’s multiple test was used for multiple comparisons. *P < 0.05. Effect size, η2 = 0.64.
