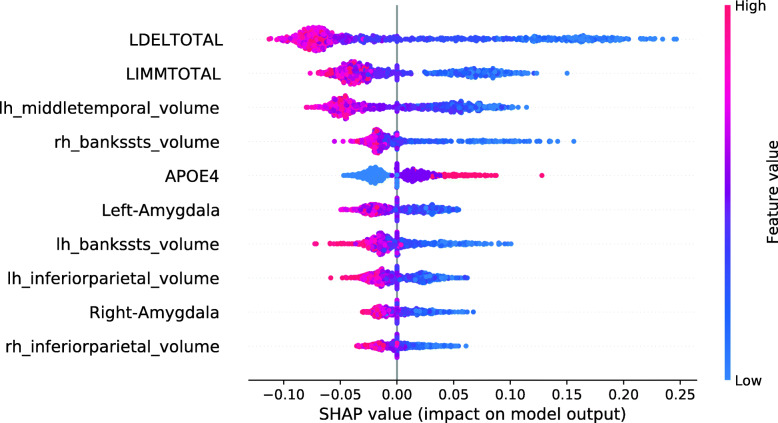
Fig. 13.
SHAP summary plot for the RF model. 134 training subjects with the smallest RF Data Shapley values were excluded. SHAP summary plots aggregate the explanation of individual predictions of the entire training and test set. Each point visualizes a Shapley value for a subject and a feature. The color of the points depends on the feature values, and the horizontal axis shows the calculated Shapley values. The vertical axis represents both the features, ordered by the mean absolute Shapley values and their distribution. The positive class is pMCI

