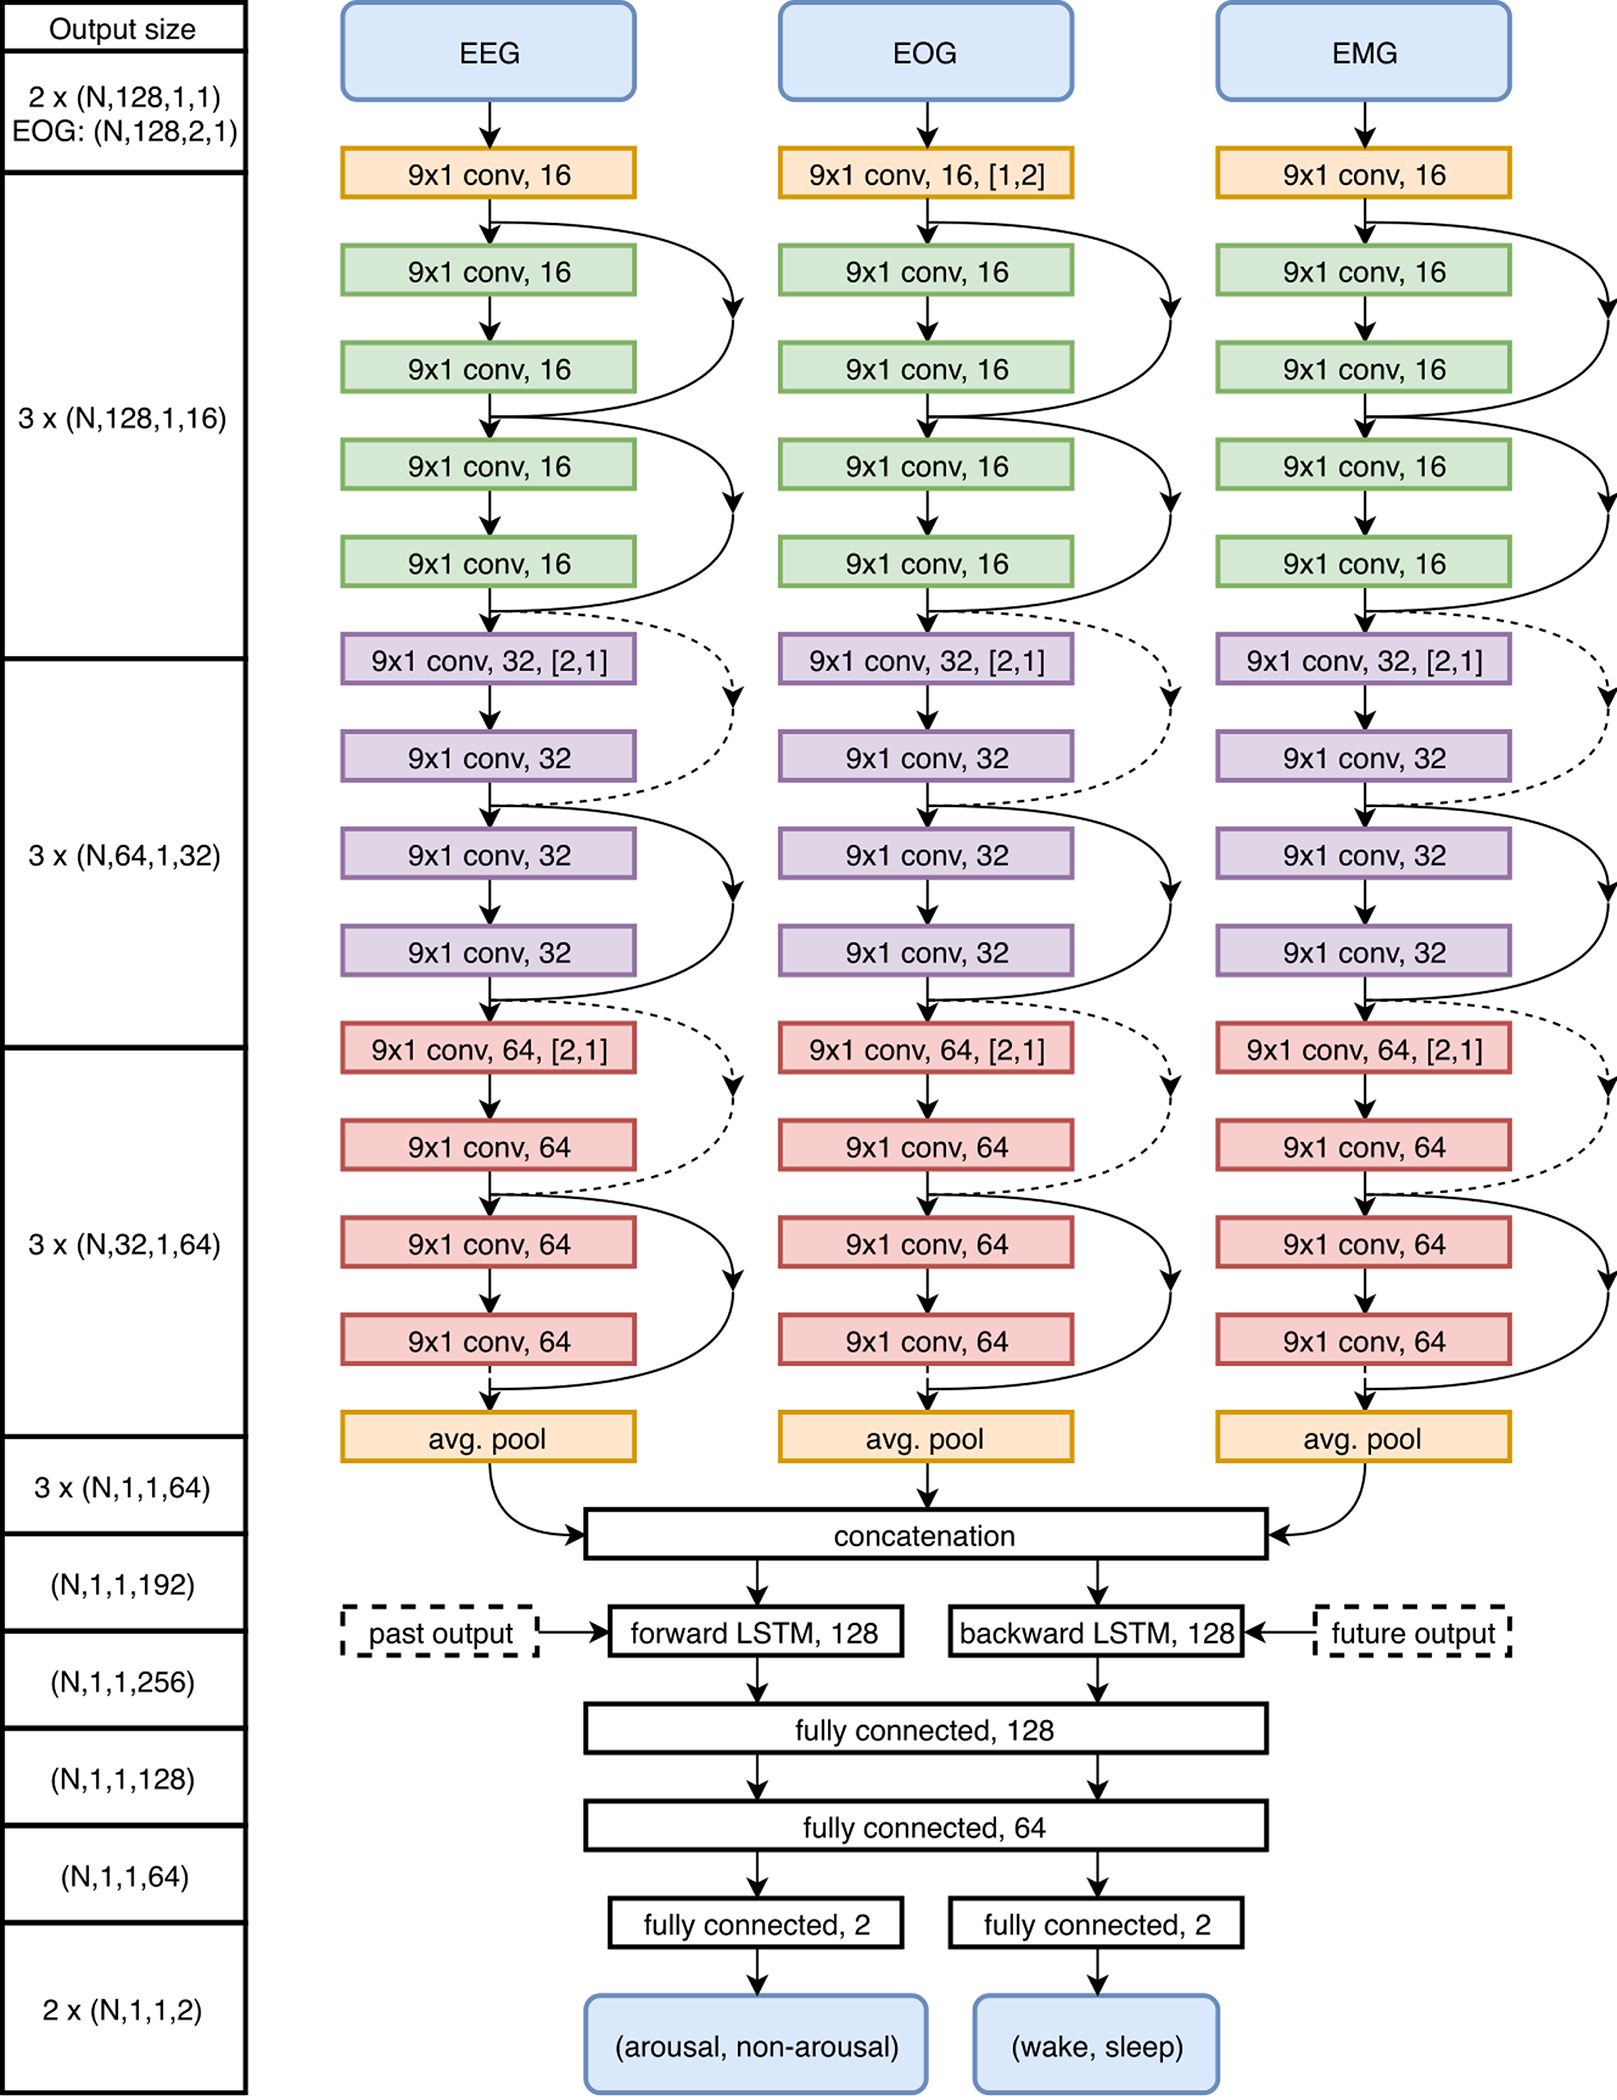
Figure 3:

Deep neural network architecture visualization for MAD. The left column displays the output size throughout the network with dimensions defined as (N: mini-batch size, height, width, channels). Convolutional layers are described by filter kernel size, feature map size, and stride. LSTM layers are described by the number of cells. Fully connected layers are described by the number of hidden units. Shortcut connections are displayed as arrows that are either filled or dashed, dashed arrows indicate the use of zero-padding and max pooling to match dimensions.
