Figure 2 .

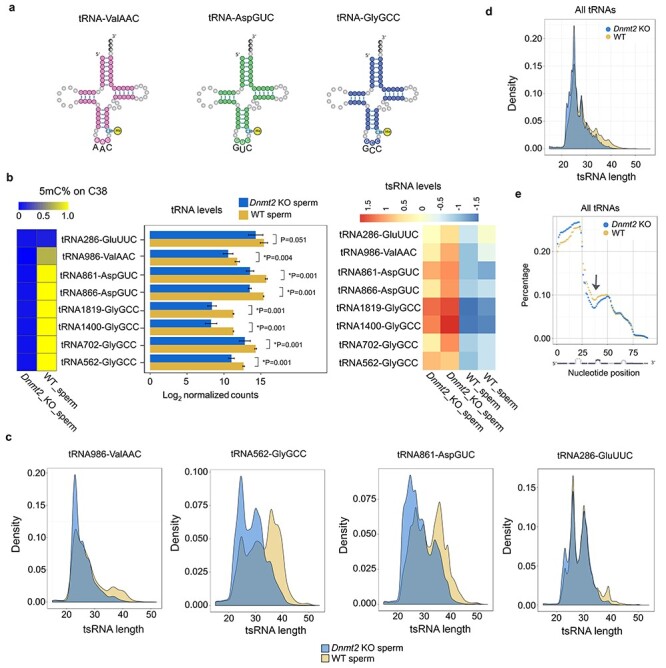
Altered tsRNA profiles in Dnmt2-null sperm characterized by decreased m5C levels on C38 of substrate tRNAs, reduced total substrate tRNA levels, increased tsRNA levels, and global shortening of total tRNAs. (a) Schematics of the three confirmed substrate tRNAs of DNMT2 (tRNA-ValAAC, AspGUC, and GlyGCC) in mice. (b) Levels of 5mC on C38 (left panels), total tRNAs (middle panels), and tsRNAs of the seven isodecoders of three substrate tRNAs in Dnmt2 KO and wild-type (WT) sperm. Heatmap (left panels) shows the mean percentage of m5C on C38 of tRNAs, and the bar graphs (middle panels) indicate the log2 values of normalized counts of tRNA reads mapped to full-length reference tRNAs, which represent the total levels of the three substrate tRNAs in Dnmt2 KO and WT sperm. The relative levels of substrate tRNAs-derived tsRNAs are reflected by the counts of reads mapped to 5′ and 3′ 26 nt reference tRNAs normalized against total tRNA counts (heatmap in the right panels). A non-DNMT2 substrate tRNA (tRNA286-GluUUC) was used as a control. The data were presented as means ± SD from biological replicates, n = 2. Sums of two technical repeats in each of the biological replicates were used for analyses. *: P < 0.05. (c) Density plots showing the length distribution of tsRNAs derived from three substrate tRNAs (tRNA986-ValAAC, tRNA562-GlyGCC, and tRNA861-AspGUC) and one non-DNMT2 substrate (tRNA286-GluUUC) in Dnmt2 KO and WT sperm. (d) Density plots showing the length distribution of the tsRNAs derived from both substrate and nonsubstrate tRNAs. (e) Distribution of individual nucleotides along the entire length of tRNAs. The normalized percentage abundance (y axis) was plotted against positions of each nucleotide (x axis). Note that a stretch of nucleotides around the anticodon region (27–45 nt) of tRNAs was drastically underrepresented (arrow) and that 5′ tsRNAs appeared to be more abundant than 3′ tsRNAs in WT sperm, and this bias appeared to be more evident in Dnmt2-null sperm.
