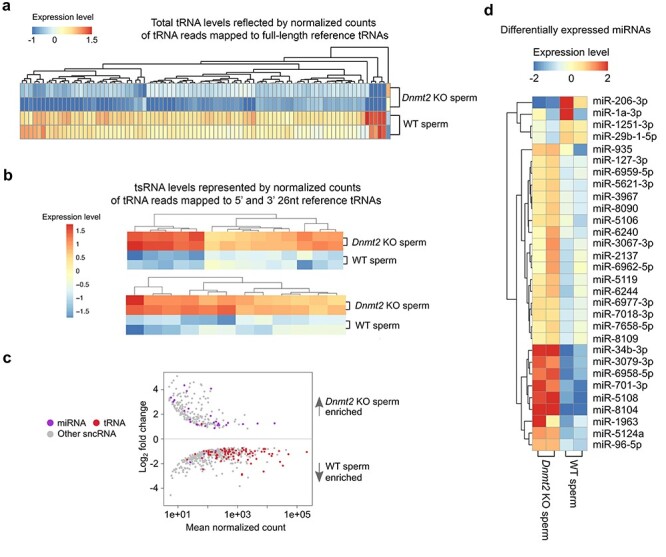
Figure 3 .

Altered profiles of other sperm-borne sncRNAs in Dnmt2-null sperm. (a) Heatmap showing differentially expressed total tRNA levels between WT and Dnmt2 KO sperm (P < 0.05). The relative expression levels are presented by the mean-centered and normalized log-expression values. (b) Heatmap showing differentially expressed tsRNA levels between WT and Dnmt2 KO sperm (P < 0.05). (c) MA plots showing differentially expressed (P < 0.05) miRNAs, tRNAs, and other sncRNAs between WT and Dnmt2 KO sperm. Mean normalized counts represent the mean value of DESeq2 normalized counts (>5) between WT and Dnmt2 KO sperm. Log2 fold change was calculated by the Log2 sncRNA counts of Dnmt2 KO sperm/WT sperm. (d) Heatmap showing differentially expressed miRNAs between WT and Dnmt2 KO sperm (P < 0.05). The relative expression levels are presented by the mean-centered and normalized log-expression values. sncRNAs-Seq data were from two biological replicates with two technical repeats (n = 2).
