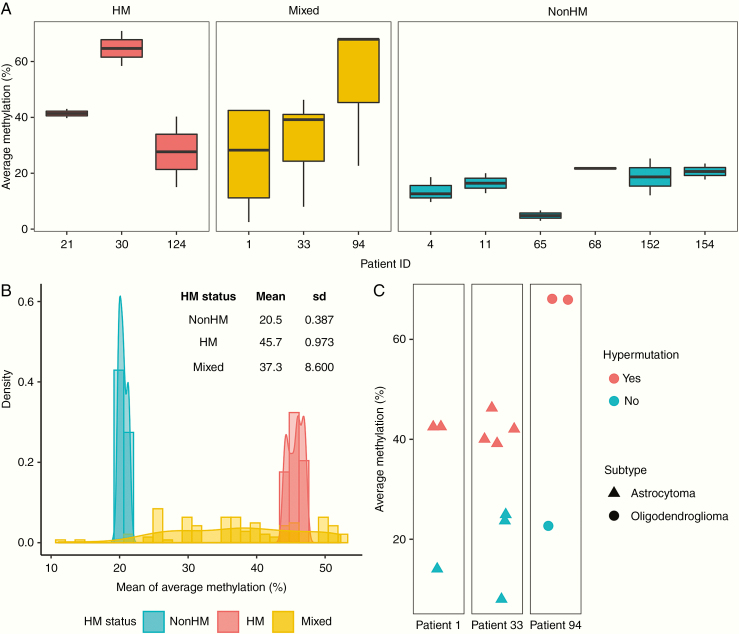
Fig. 4.
Intratumoral analysis of MGMT promoter methylation and hypermutation. (A) Average methylation level at the MGMT promoter methylation for individual recurrence samples from the patient, classified by HM status. (B) Quantification of variation in MGMT promoter methylation levels by bootstrapping. (C) Average methylation level and presence of hypermutation in individual recurrence samples of patients with Mixed HM status.

