FIGURE 3.

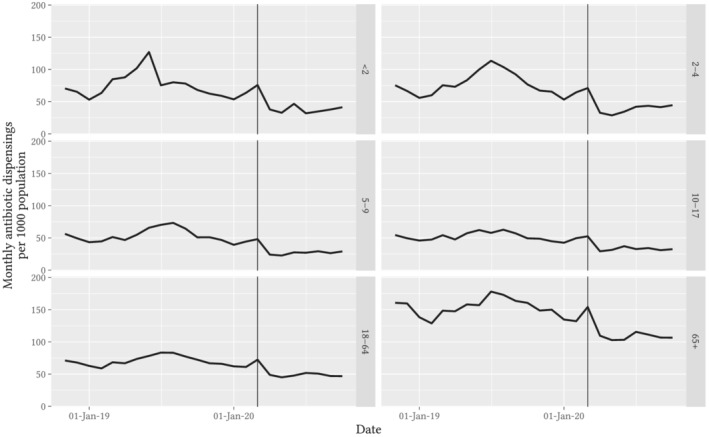
Observed trends in monthly rate of antibiotic dispensings per 1000 Australian population, stratified by age on the day of dispensing. Note: Vertical guideline marks the data for March 2020

Observed trends in monthly rate of antibiotic dispensings per 1000 Australian population, stratified by age on the day of dispensing. Note: Vertical guideline marks the data for March 2020