
FIGURE 3.
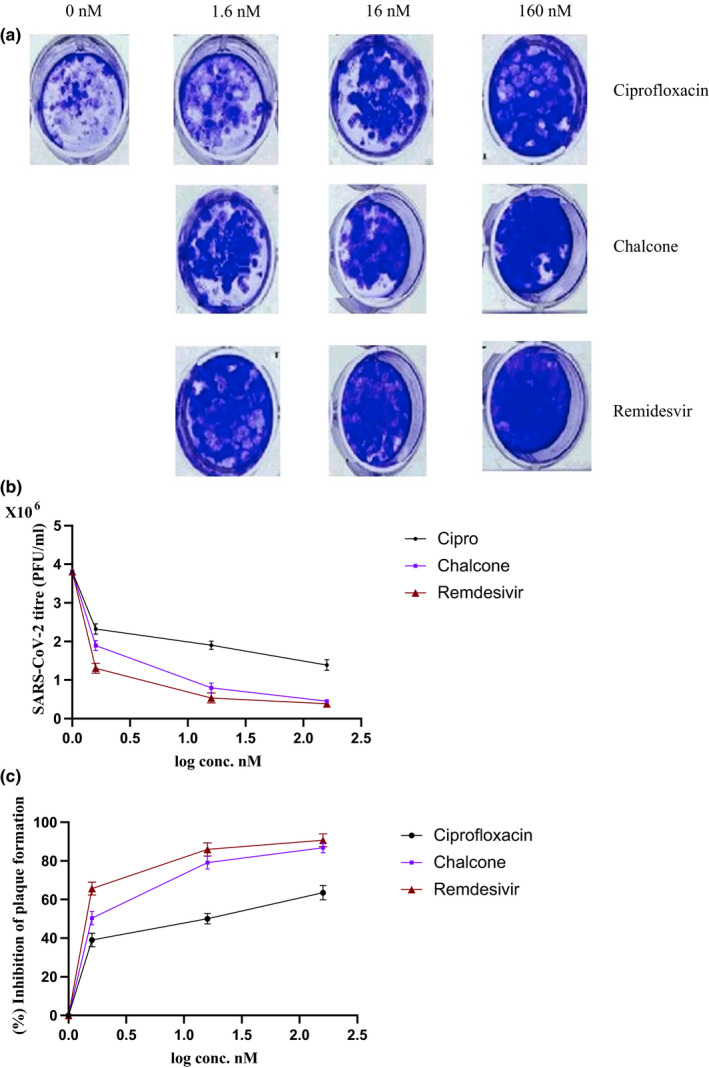
Plaque formation ability of SARS‐CoV‐2 after treatment with ciprofloxacin and the chalcone. Remdesivir was used as positive control. (a) Representative photos of plaque formation after treatment with different concentrations of ciprofloxacin and the chalcone. (b) The plaque formation ability (PFU/ml) of SARS‐CoV‐2 after treatment with different concentrations of ciprofloxacin and the chalcone. (c) Percentage of inhibition of SARS‐CoV‐2 plaque formation after ciprofloxacin and the chalcone treatment at different concentrations. Data represents mean ± SD. Significant difference was analysed by one‐way ANOVA test and student t‐test. **P < 0.01, ***P < 0.001, compared to infected untreated cells