
FIGURE 1.
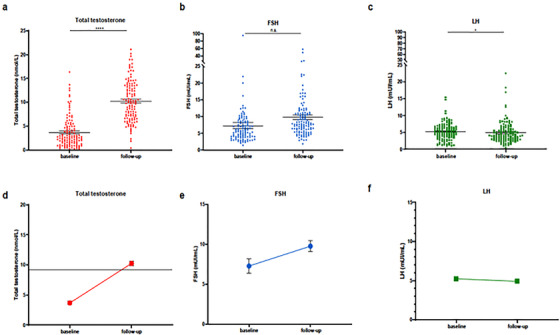
Scatter plot, vertical. Sex‐related hormonal analyses at baseline compared to 6‐month follow‐up in COVID‐19 patients. (A and D) Total testosterone. (B and E) Follicule‐stimulating hormone (FSH). (C and F) Luteinizing hormone (LH). *p = 0.01; ****p < 0.0001