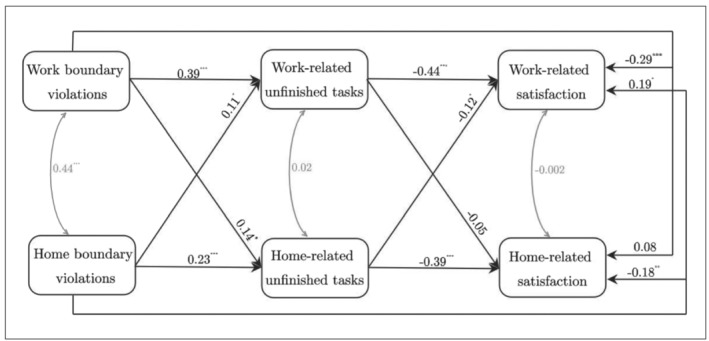
FIGURE 1.

Within‐level estimates of the model 2 direct effects. Note. The figure displays standardized estimates and unstandardized p‐values. * p ≤ .05. ** p ≤ .01. *** p ≤ .001

Within‐level estimates of the model 2 direct effects. Note. The figure displays standardized estimates and unstandardized p‐values. * p ≤ .05. ** p ≤ .01. *** p ≤ .001