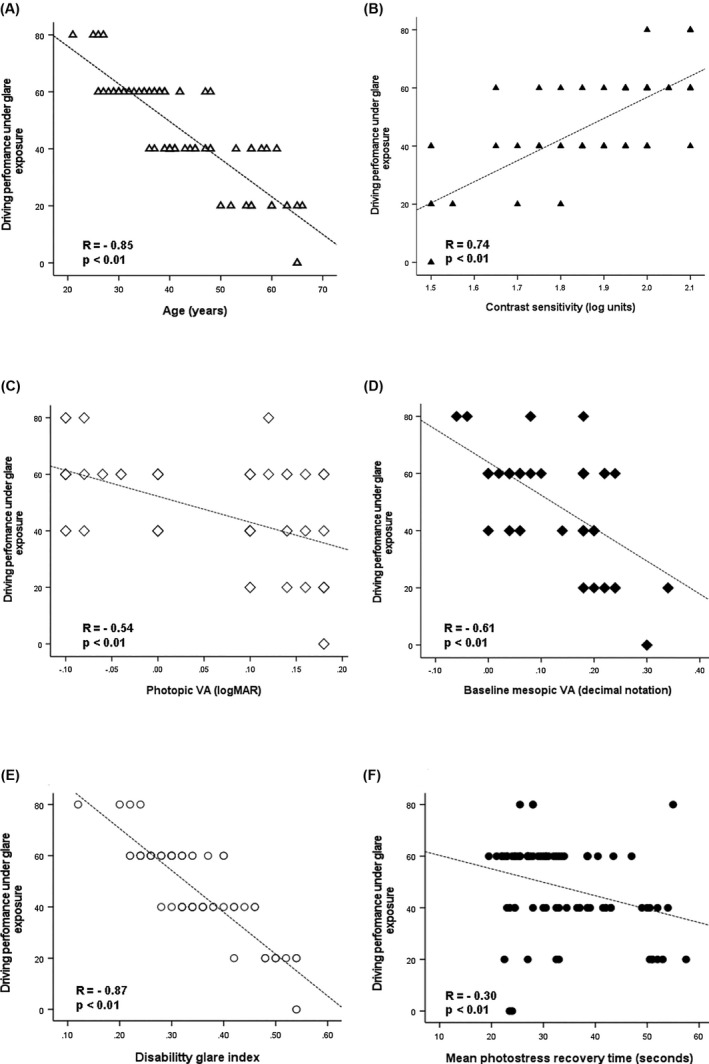
FIGURE 3.

Scatter plots showing the relationship of nighttime driving performance under glare exposure with age (panel A), contrast sensitivity (panel B), photopic VA (panel C), baseline mesopic VA (panel D), disability glare index (panel E) and photostress recovery time (panel F)
