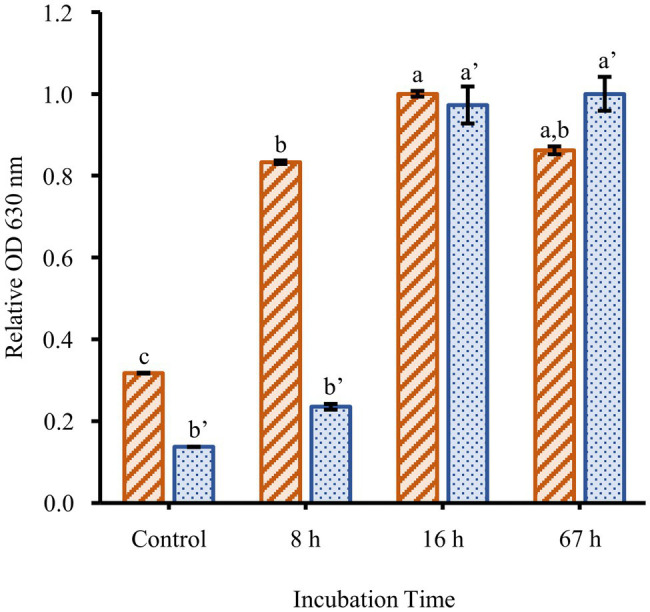
Figure 2.

Time course of biofilm formation. The planktonic growth (orange-striped bars) and biofilm formation (blue-dotted bars) of F. johnsoniae wild type grown in a 1/40 dilution of CYE media. Results are reported as relative OD values (averages of at least four replicates; normalized to highest average in dataset). Error bars indicate 95% CI. Different letters above the error bars represent different significance groups among growth and biofilm measurements (one-way ANOVA followed by Tukey test, value of p=0.05).
