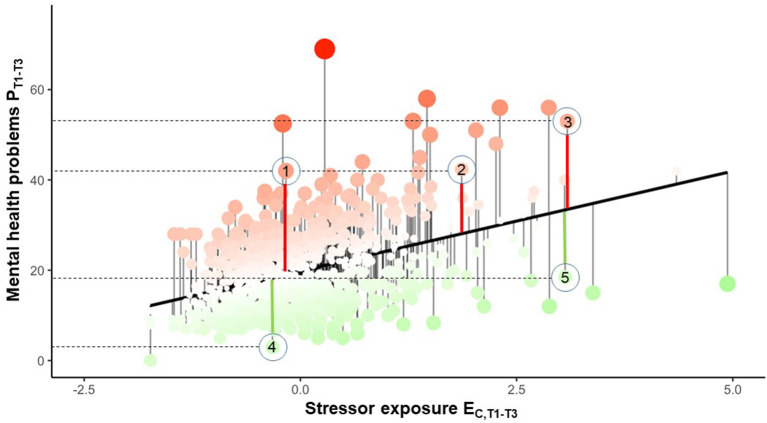
Figure 4.
Individual mental health reactivity to stressor exposure (“stressor reactivity”). The regression line shows the normative linear positive relationship between combined exposure to LEs and DHs stressors (EC,T1−T3) and mental health problems (PT1−T3) in subjects providing partial data during the first 9 months of the study (monitoring time points T1–T3). The residuals onto the regression line are subjects' deviations from the normative EC-P relationship. A strong positive deviation reflects high susceptibility of the subject's mental health to the effects of DHs and LEs (high stressor reactivity, SR) during the chosen time window; a strong negative deviation reflects abnormally low susceptibility (low SR). 1–5 denote arbitrarily chosen subjects.

