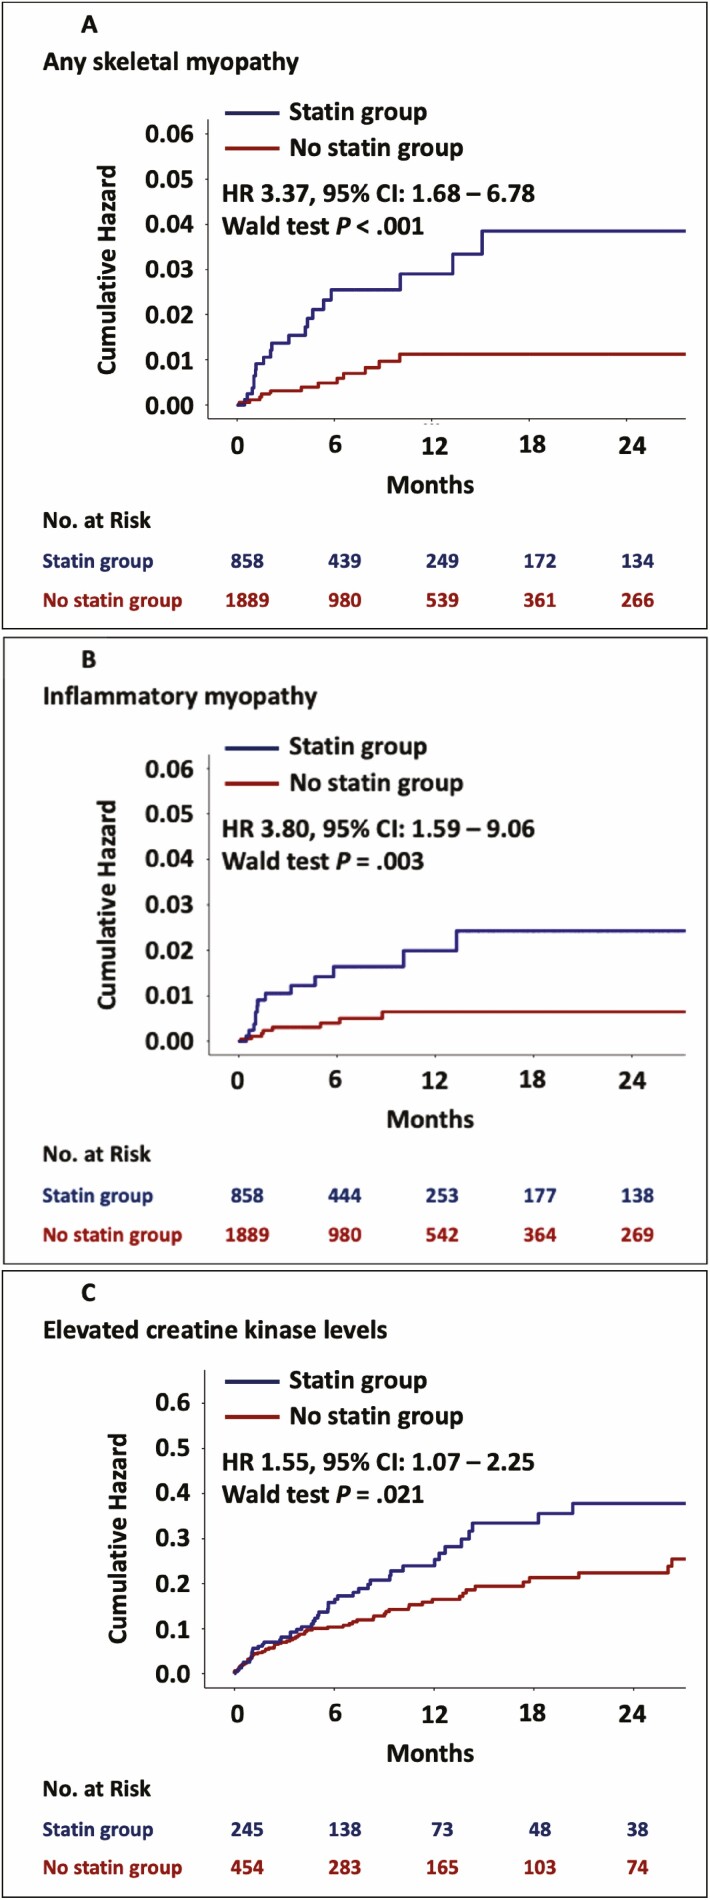
Figure 2.
Kaplan–Meier curves of the cumulative hazard in statin users and non-users and number at risk tables. Panel A shows the cumulative hazard of any skeletal myopathy. Panel B shows the cumulative hazard of inflammatory myopathy and panel C shows the cumulative hazard of creatine kinase elevation.

