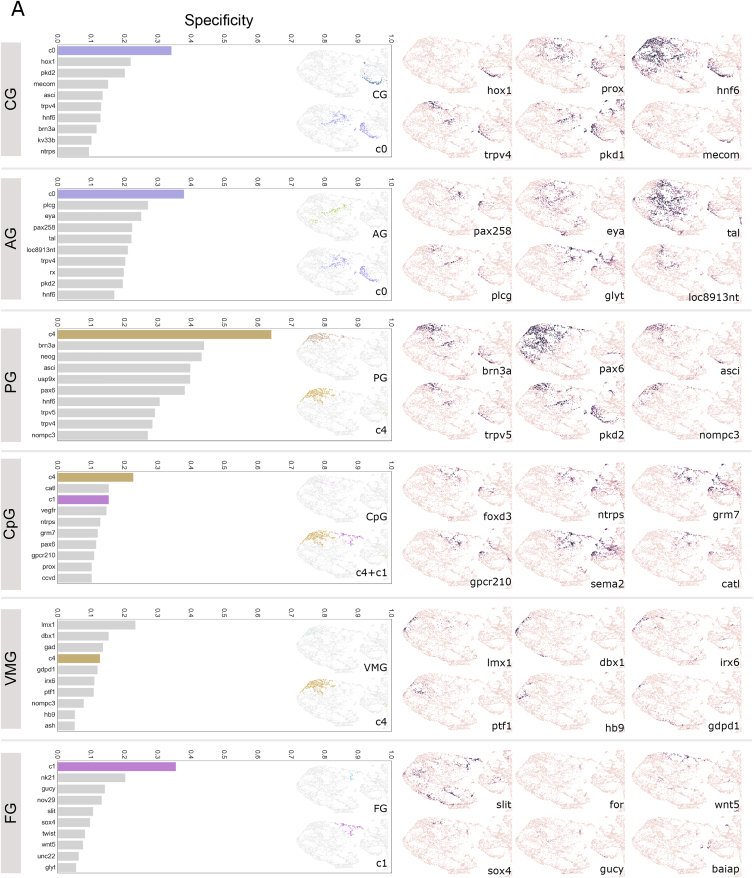
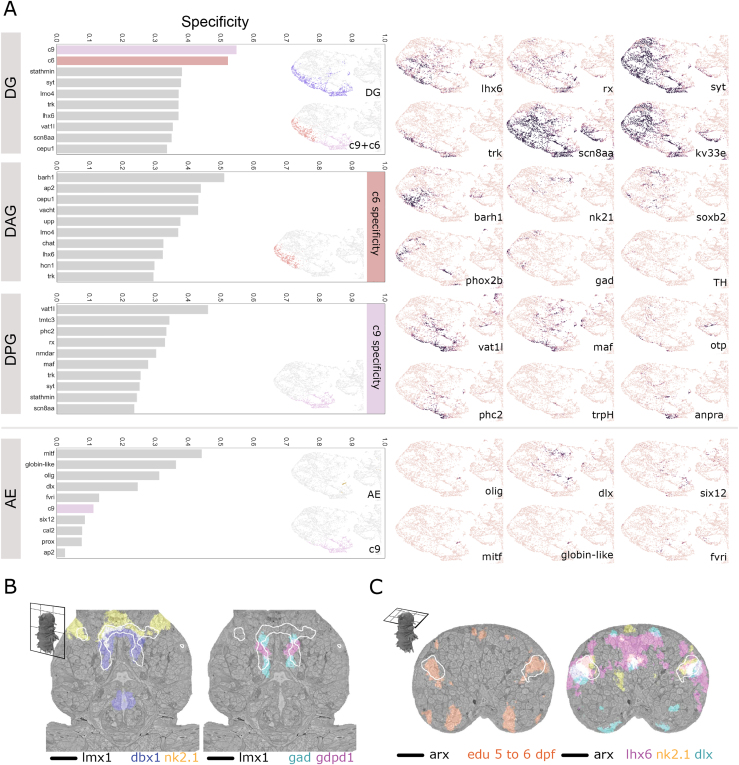
Figure S4.
Specificity of gene clusters and individual genes for head ganglia, related to Figure 5
A: Comparison of specificity of gene clusters and individual genes for the head ganglia. Left column – graphs of top 10 scoring genes (gray bars) or gene clusters (colored bars) by F1 specificity score (see methods). Inset– zooms of the head region of the UMAP from Figure 5A colored by ganglia (top) and top scoring genetic clusters (bottom). Right column - gene expression overlap value (0-1, same scale as in Figure 5E) for example genes. Note: here we show only the head region of the UMAPs, for easier comparison, but some genes and gene clusters have expression domains outside of the head which contribute to their lower specificity scores. loc8913nt corresponds to the ionotropic glutamate receptor igluR. Other genes starting with ‘loc’ are GPCR-related but without clearly identified homologs. Abbreviations: AG, antennal ganglia; CG, cirral ganglia; CpG, circumpalpal ganglia; FG, frontal ganglion; VMG, ventro-medial ganglia. B: Frontal cross-section of the ventral brain illustrating co-expression of genes in the ventromedial ganglion. The expression region of lmx1 is illustrated with white contours. C: Dorsal cross-section of the brain illustrating one of the proliferative regions of the mushroom bodies and the specific co-expression of transcription factors. The expression region of arx is illustrated with white contours. Panels B and C are available as bookmarks in the PlatyBrowser. Abbreviations: AE, adult eyes; DG, dorsal ganglion; DAG, dorso-anterior ganglion; DPG, dorso-posterior ganglion.


