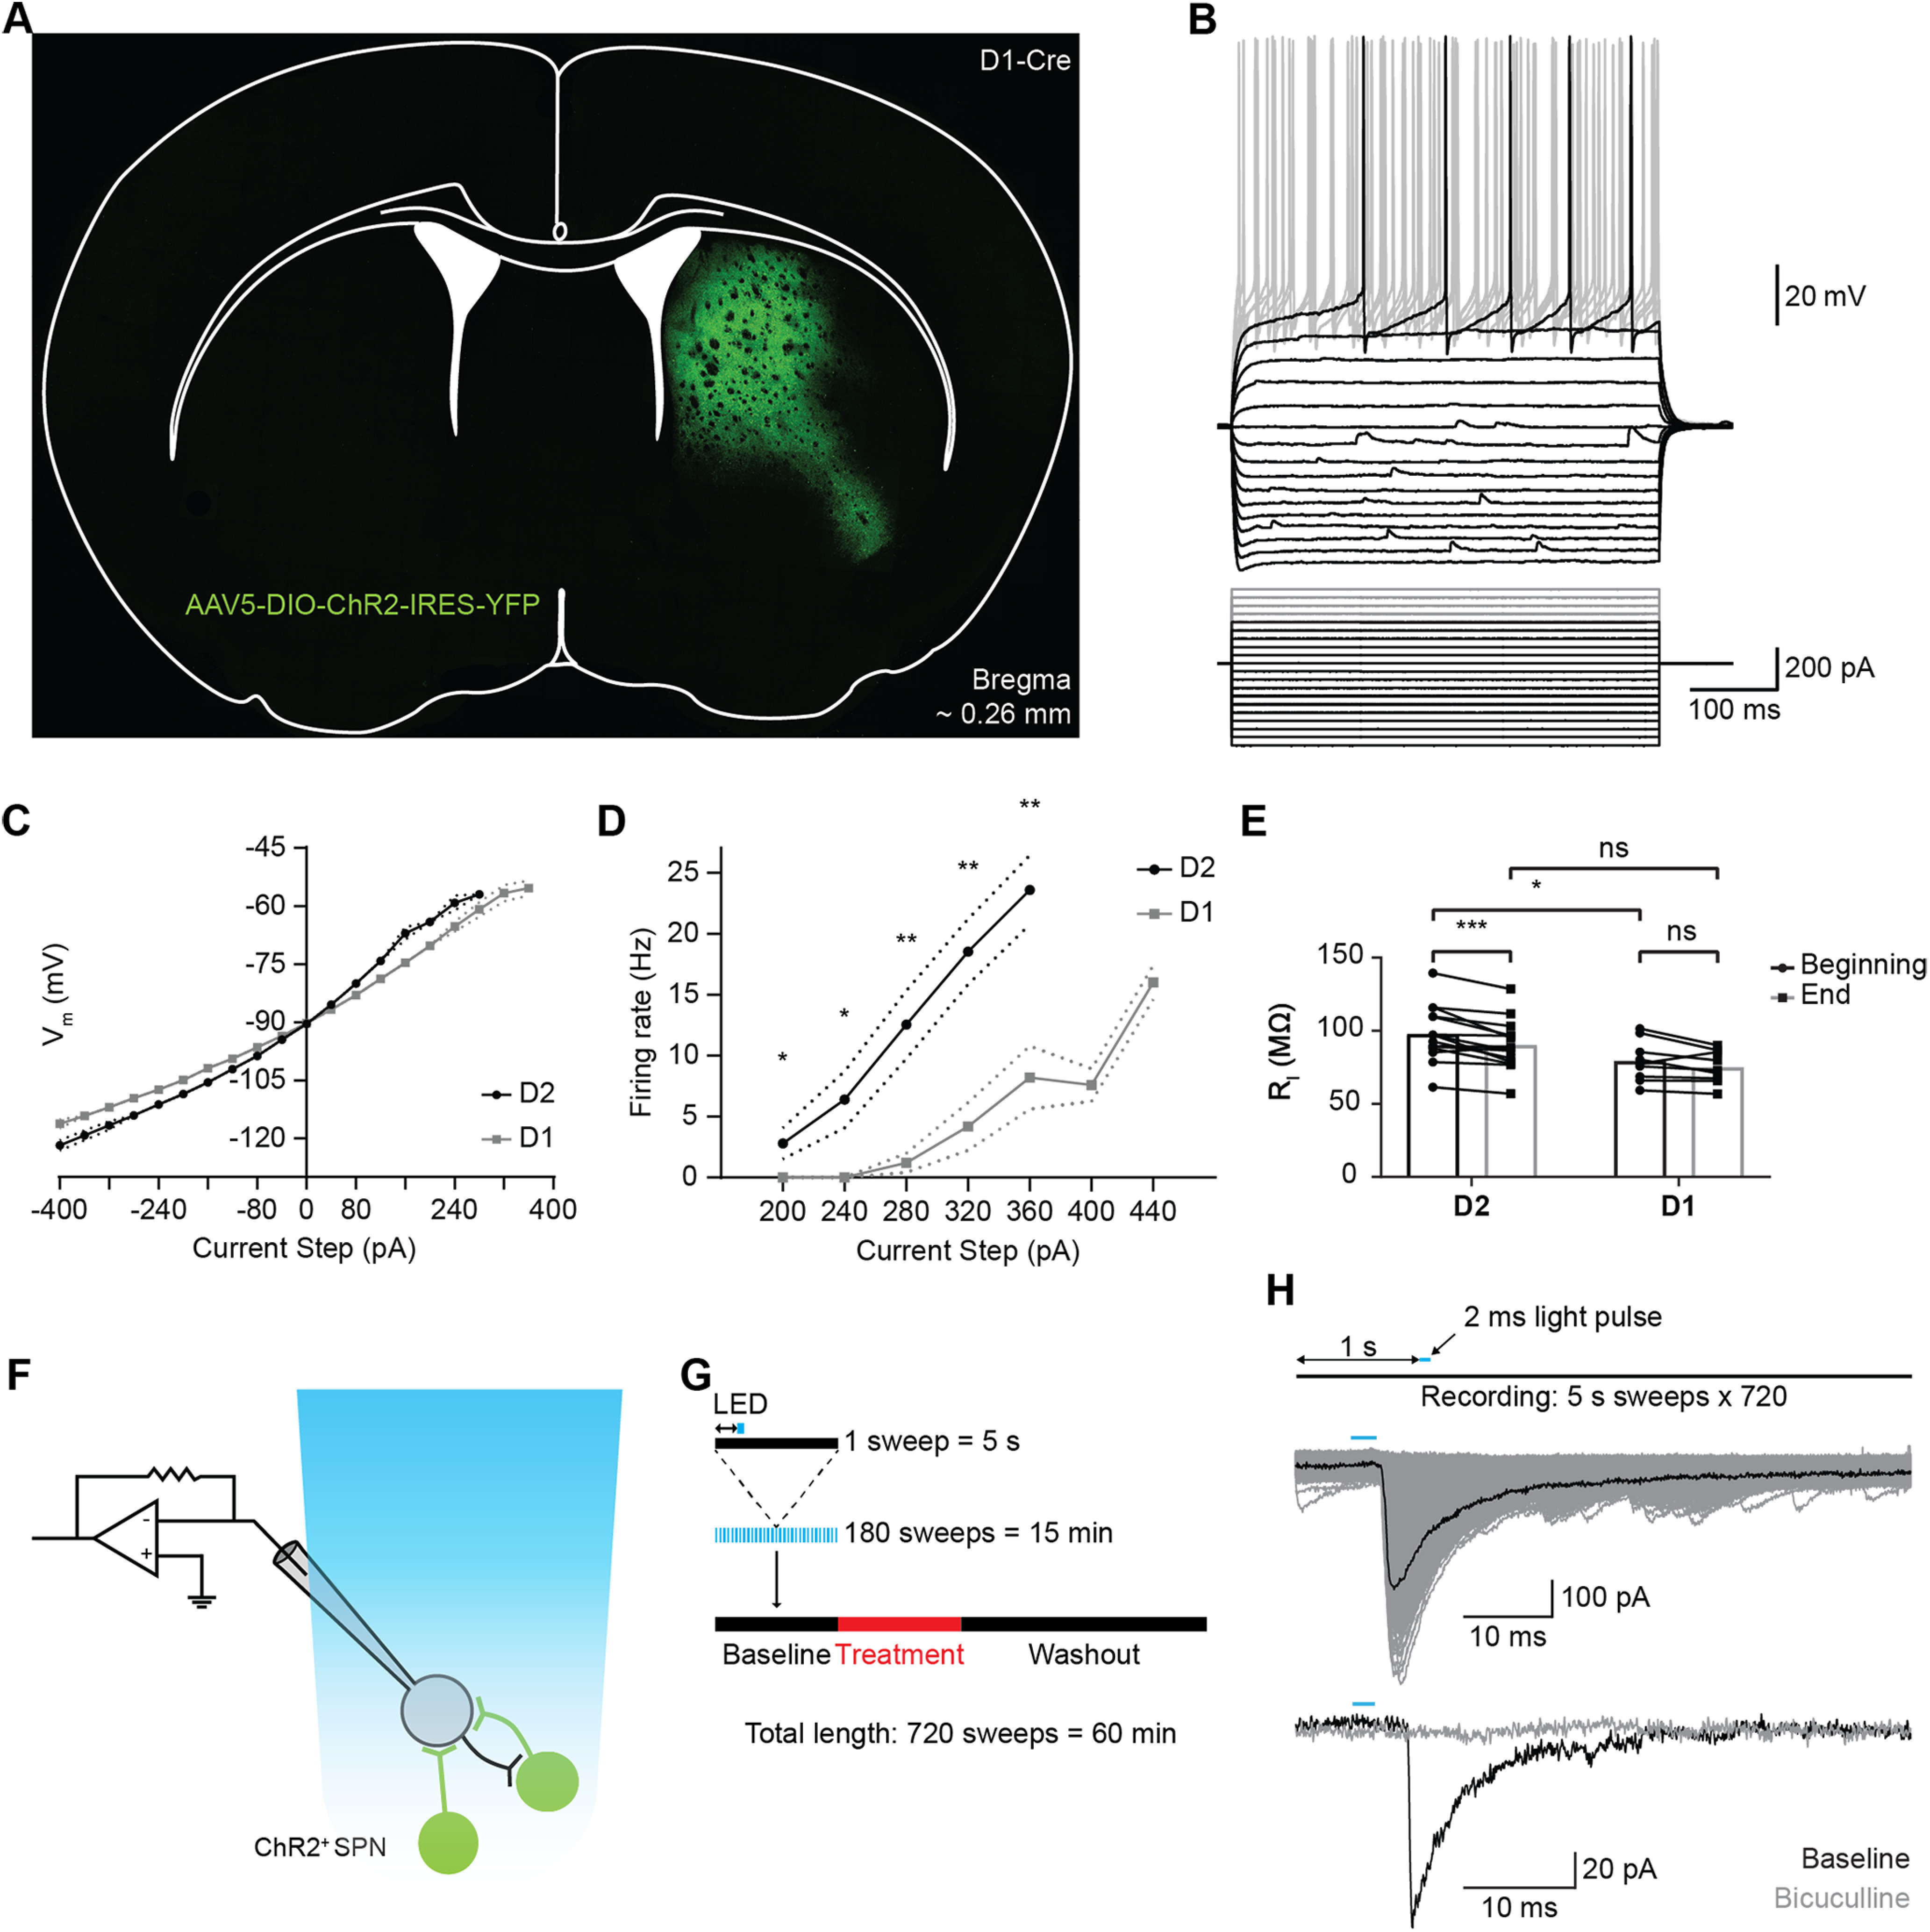
Figure 1.

Properties of postsynaptic ChR2- neurons in ChR2 injected mice. A, Specific expression of ChR2 in a D1-Cre mouse. Position: bregma ∼0.26 mm. B, Superimposed voltage traces of an example SPN in response to a series of current steps shows inward rectification. Small depolarizations in the membrane potential are spontaneous events. Only the first AP-eliciting step is shown in black for clarity. The cell was held at −90 mV. C, Average IV-curve of subthreshold membrane potential from D1 and D2-SPNs. The voltage response curve is close to linear for hyperpolarizing steps and increases exponentially above −90 mV. V**alues are mean ± SEM. Dotted lines represent SEM were applicable. N = 14/10, D2/D1. D, Average firing frequency versus current intensity for D1 and D2-SPNs. Values are mean ± SEM. Dotted lines represent SEM were applicable. N = 14/9, D2/D1. E, Average input resistance (RI) of postsynaptic SPNs at the beginning (first minute) and end (last minute) of recording. The input resistance is slightly lower for D1-SPNs. F, Whole-cell patch clamp of SPNs recording IPSCs evoked by optogenetic stimulation of lateral ChR2+ SPNs. G, Recording protocols for ChR2-evoked IPSCs in voltage clamp configuration. Membrane current is recorded in repeated 5-s sweeps. A single 2-ms light pulse (blue bar) is given one second (double arrowheads) after the start of each sweep. H, Example IPSC response (middle graph) to presynaptic optogenetic stimulation (upper graph). APs were triggered with a 2-ms light pulse. Gray traces are an overlay of repeated stimulation. Lower graph, Example trace of an IPSC after a 2-ms light pulse in control ACSF (black trace) and in the presence of bicuculline (gray trace). All recordings were done in the presence of KA. ns, p > 0.05; *p < 0.05, **p < 0.01, ***p < 0.001, ****p < 0.0001.
