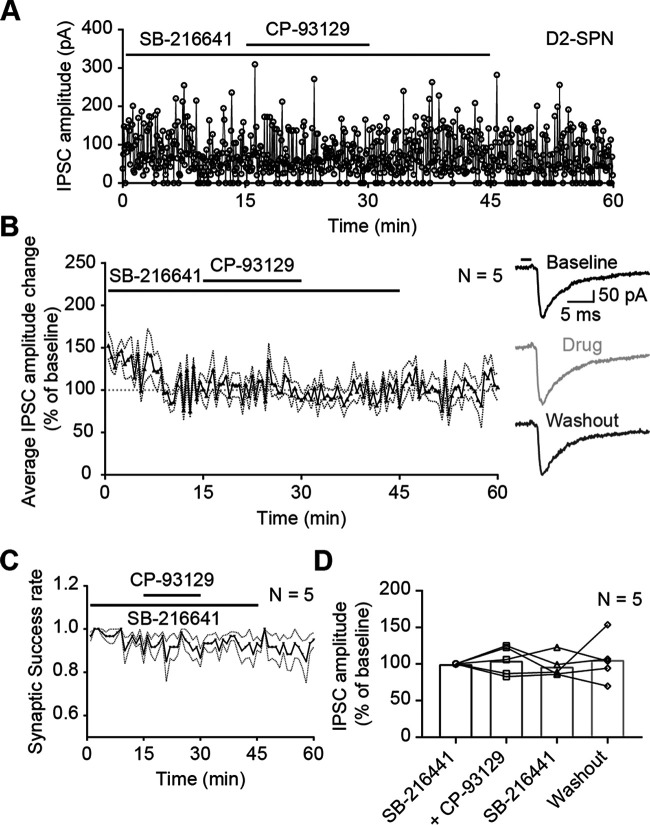
Figure 10.
Optical-evoked APs are somatic. A, Example recording of IPSC amplitudes in a D1-SPN (A2a-Cre mouse) in the presence of sodium channel blocker TTX (0.5 µm). B, Average IPSC amplitude change during TTX treatment in D1-Cre and A2a-Cre mice [N = 4: D1-Cre (1), A2a-Cre (3)]. Horizontal line at 100% was added as visual guideline. Dotted lines represent SEM IPSC amplitude change was normalized against minutes 10–15 (baseline). Each point is an average of six IPSC events. The traces on the right are examples recorded during baseline (black), drug treatment (light gray), and CP-93129 washout (dark gray). The black bar represents the 2-ms light pulse. C, Average group synaptic success rate of SPNs with TTX. Dotted lines represent SEM. D, Before and after plot of average IPSC amplitude change of SPNs with TTX. Bars represent the mean. All recordings were done in the presence of KA.

