Figure 6.

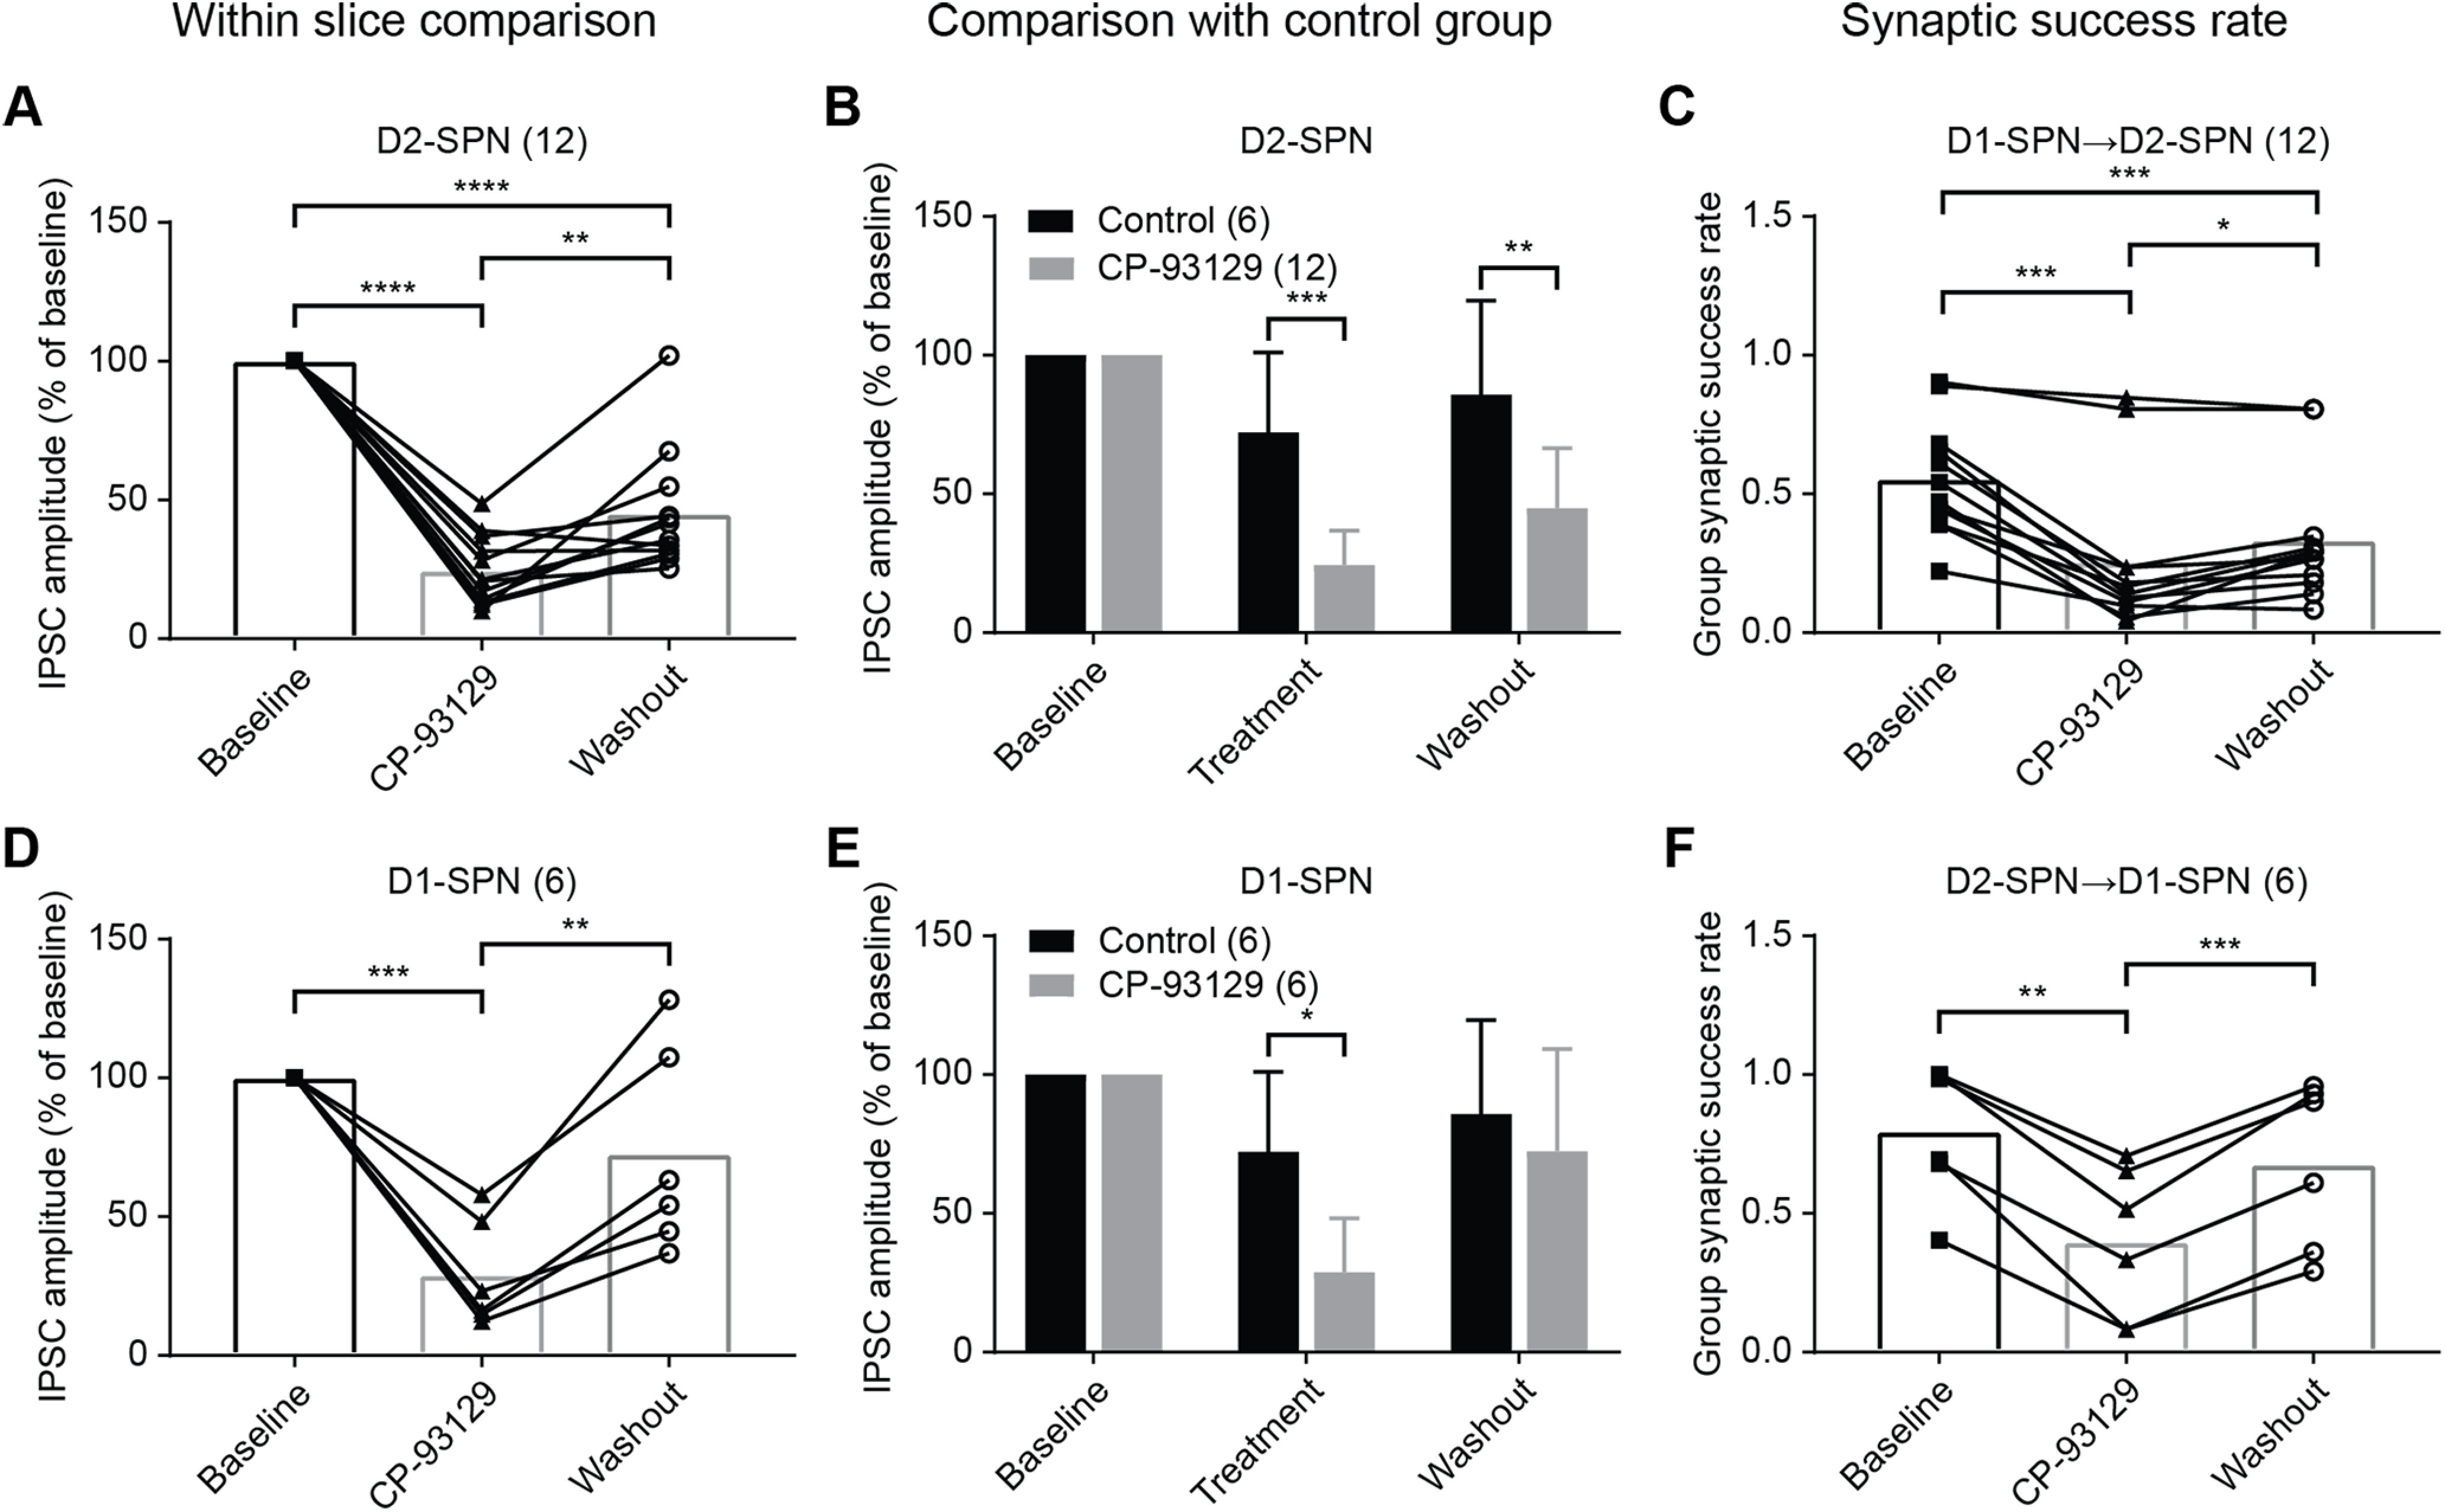
CP-93129 changes average IPSC amplitude and synaptic release probability in local axon collaterals. A, Statistical analysis of average IPSC amplitude change in D2-SPNs (D1-Cre mice) during baseline, drug treatment, and washout (N = 12). B, Comparison of average IPSC amplitude of drug treatment in D2-SPNs (D1-Cre mice, N = 12) with control group (N = 6). Mean ± SD. C, Analysis of average group synaptic success rate for D1→D2-SPN connections (D1-Cre mice, N = 12). D, Statistical analysis of average IPSC amplitude change in D1-SPNs (A2a-Cre mice) during baseline, drug treatment, and washout (N = 6). E, Comparison of average IPSC amplitude of drug treatment in D1-SPNs (A2a-Cre mice, N = 6) with control group (N = 6). Mean ± SD. F, Analysis of average group synaptic success rate for D2→D1-SPN connections (A2a-Cre mice, N = 6). ns, p > 0.05; *p < 0.05, **p < 0.01, ***p < 0.001, ****p < 0.0001.
