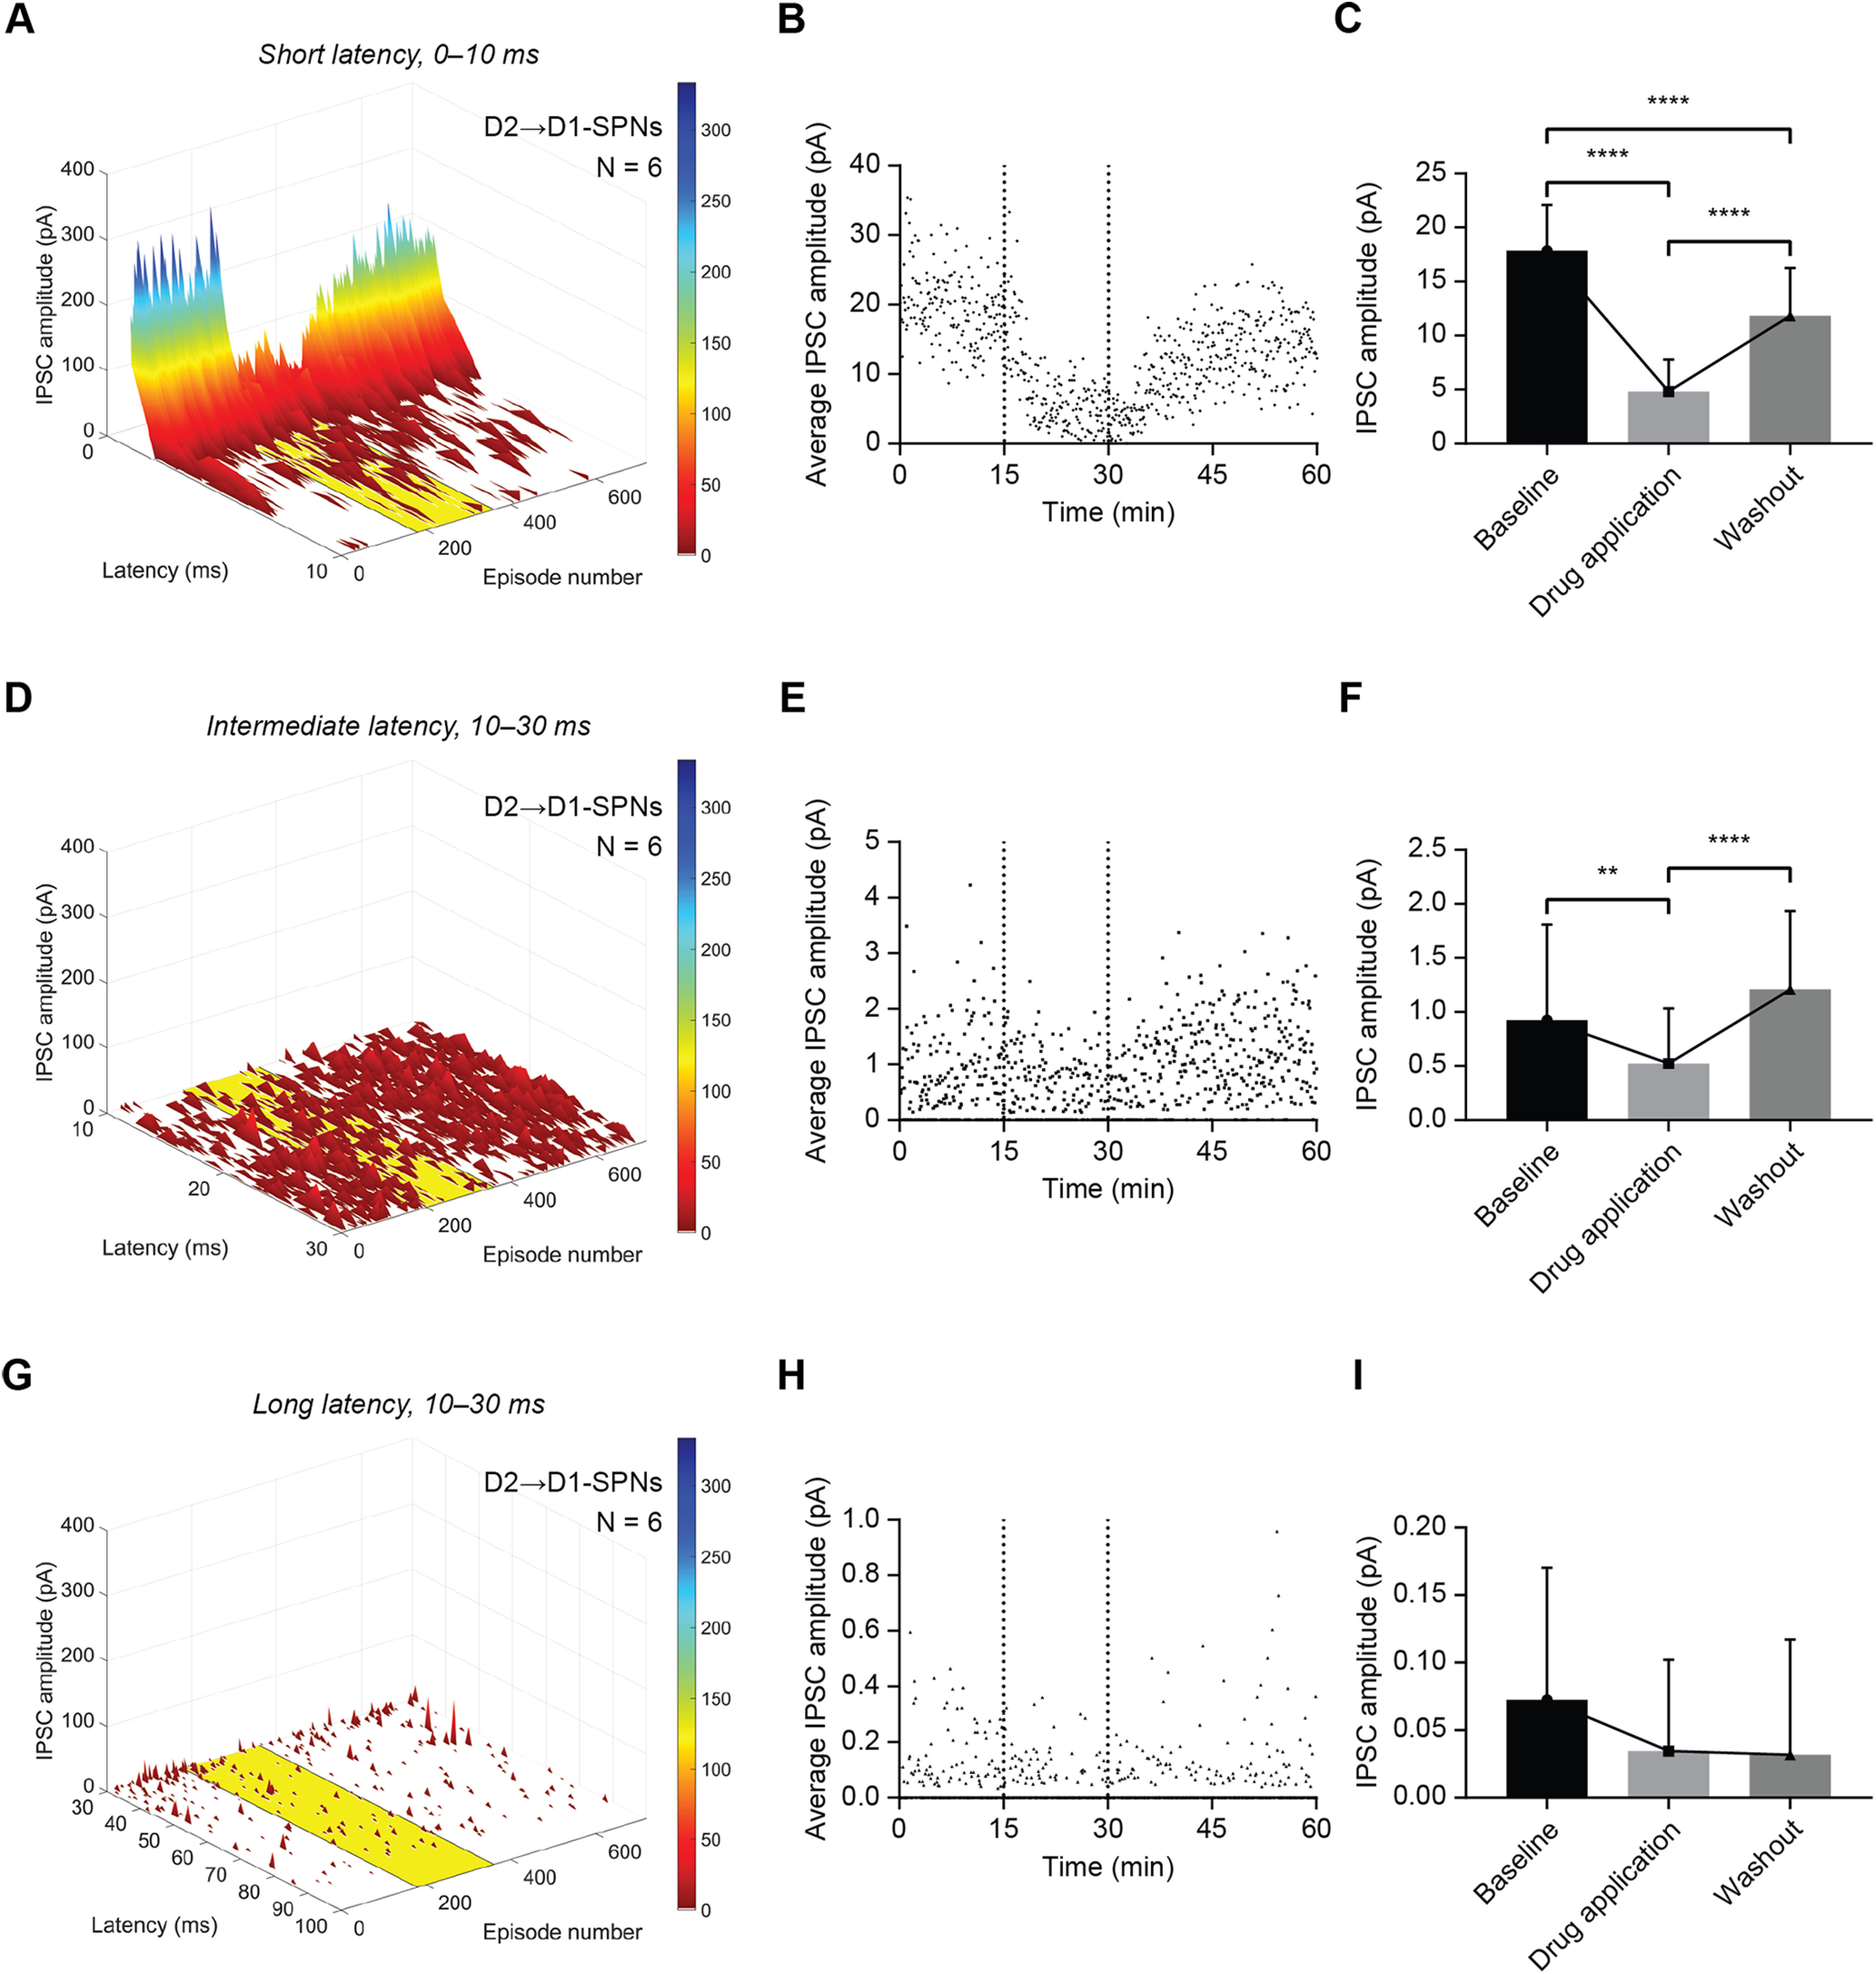
Figure 8.

CP-93129 affects ChR2-evoked IPSCs in D1-SPNs up to 30 ms after optical stimulation. A, Average distribution and amplitude of IPSCs recorded in D1-SPNs (A2a-Cre mice) within the first 10 ms after the light stimulus. Note the higher average amplitude compared with D2-SPNs. The yellow area indicates application of CP-93129. Each episode equals 5 s. B, Average IPSC amplitude of all recorded IPSCs in D1-SPNs (A2a-Cre mice) with a latency of ≤10 ms over 60 min. The two dotted lines mark the application of CP-93129. C, Statistical analysis of average IPSC amplitude within 10 ms after the light pulse in D1-SPNs (A2a-Cre mice) during baseline, drug treatment, and washout. IPSC recovery did not reach baseline levels. Values are mean ± SD. D, Average distribution and amplitude of IPSCs recorded in D1-SPNs (A2a-Cre mice) between 10 and 30 ms after the light stimulus. The yellow area indicates application of CP-93129. Each episode equals 5 s. E, Average IPSC amplitude of all recorded IPSCs in D1-SPNs (A2a-Cre mice) with a latency between 10 and 30 ms over 60 min. The two dotted lines mark the application of CP-93129. F, Statistical analysis of average IPSC amplitude between 10 and 30 ms after the light pulse in D1-SPNs (A2a-Cre mice) during baseline, drug treatment, and washout. Values are mean ± SD. G, Average distribution and amplitude of IPSCs recorded in D1-SPNs (A2a-Cre mice) between 30 and 100 ms after the light stimulus. Each episode equals 5 s. H, Average IPSC amplitude of all recorded IPSCs in D1-SPNs (A2a-Cre mice) with a latency between 30 and 100 ms over 60 min. I, Statistical analysis of average IPSC amplitude between 30 and 100 ms after the light pulse in D1-SPNs (A2a-Cre mice) during baseline, drug treatment, and washout. Values are mean ± SD; N = 6. ns, p > 0.05; *p < 0.05, **p < 0.01, ***p < 0.001, ****p < 0.0001.
