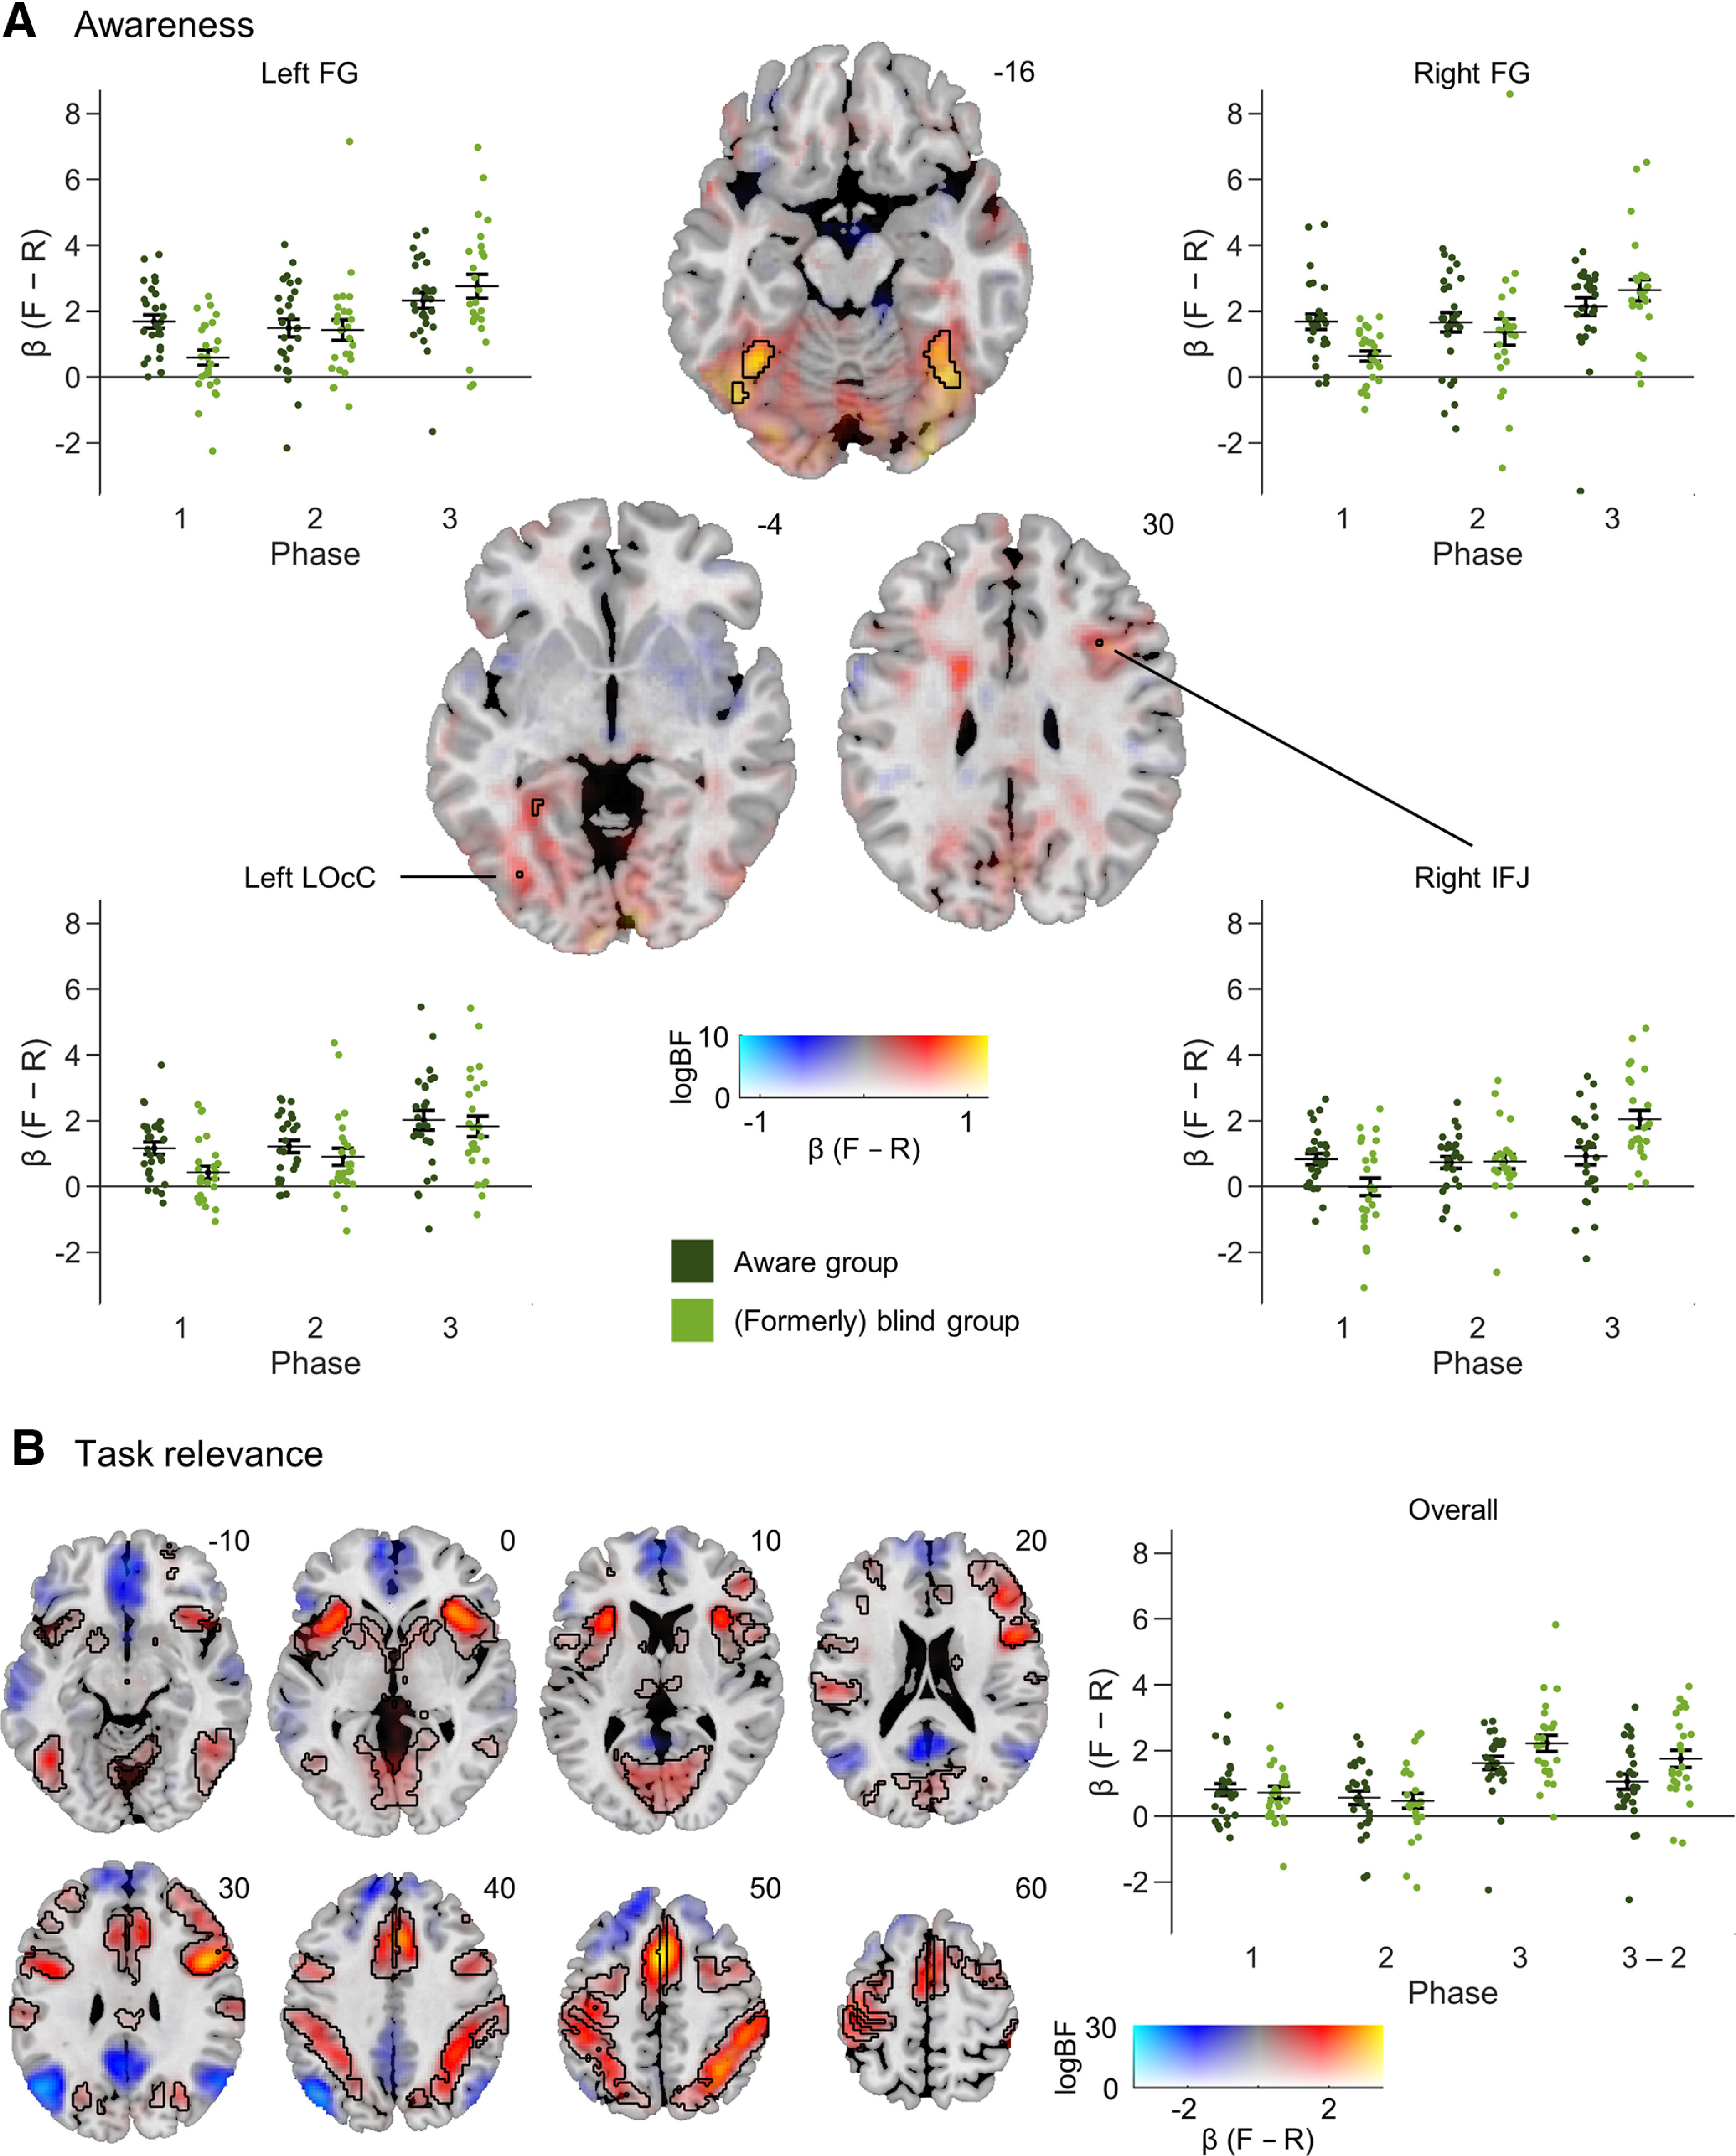
Figure 3.

Imaging results. PPMs are presented using a dual-coded approach (Allen et al., 2012; Zandbelt, 2017). The β-differences [face (F) – random (R)] are mapped to color hue, and the logBF statistic to transparency. Black contours outline gray matter activations with logBF > 5 (i.e., 99% probability of an effect). Numbers next to maps indicate z-coordinates (MNI). Scatter plots show β-differences (F − R) of single subjects split by the groups from phase 1 across all phases. Error bars denote SEs. A, Awareness contrast of BOLD responses (F – R) between blind and aware subjects in phase 1. Axial slices are centered at clusters meeting NCC criteria (i.e., the left and right FG, the left LOcC, and the right IFJ). B, Task relevance contrast of BOLD responses (F – R) between phase 3 (aware, task-relevant) and phase 2 (aware, task-irrelevant) in all subjects. Task relevance strongly activated extensive occipitotemporal, frontoparietal, and attentional networks. The scatter plot presents β-differences (F − R) averaged across all voxels with task-related activation for an overview. Additionally, pairwise differences (phase 3 – phase 2) are shown. Statistics for local effects are displayed in Table 2.
