Figure 6.
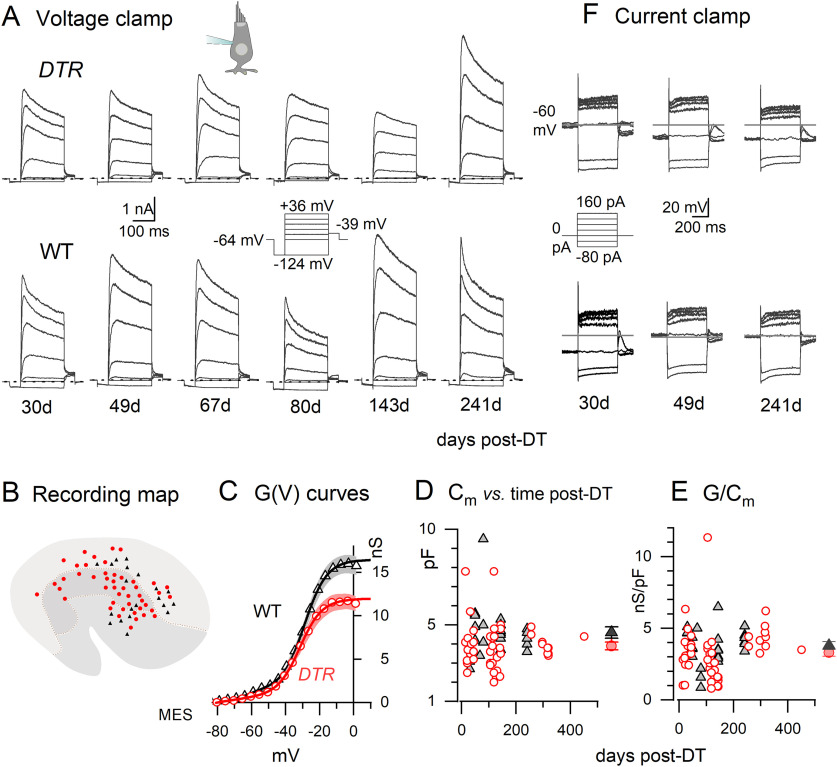
Regenerated DTR hair cells and WT type II hair cells shared key electrophysiological properties. A, Exemplar voltage-dependent current families from DTR (top) and WT (bottom) utricular maculae, at increasing days post-DT (left to right). Voltage-clamp protocol (middle, aligned with 80 d post-DT data) applies to all. Dashed lines, 0 nA; holding potential, –64 mV. All DTR cells are shown except the one at ∼70 d post-dT, which had basolateral processes (cartoon). B, Sites of recorded hair cells on the utricular macula, located by aligning photomicrographs of the fluorescently labeled hair cell with a standard map of the utricle (based on the images in Figures 1–3 in Li et al., 2008). Utricular zones are as follows: top to bottom: lateral extrastriola (light gray), striola (gray), medial extrastriola (medium gray). Black triangles, WT; red circles, DTR. C, G(V) curves fitted to averaged tail current data at –39 mV from 48 DTR and 24 WT cells (Eq. 1) had similar voltage dependence but smaller mean conductance values. Shaded areas, Mean values ± SE. Fits (Eq. 1): DTR: Gmax = 12.3 ± 0.2 nS; V1/2 = –32.3 ± 0.4 mV; S = 7.9 ± 0.3 mV; WT: Gmax = 17.3 ± 0.4 nS; V1/2 = –29.8 ± 0.7 mV; S = 8.8 ± 0.5 mV. D, Membrane capacitance (proportional to surface area) as a function of days post-DT. DTR cells (red circles) were smaller on average than WT cells (gray triangles). Filled symbols to the right in D and E are the mean ± SE. E, Conductance density (in nanosiemens per picofarad) was similar for DTR and WT cells across time post-dT. F, Exemplar families of voltage responses to injected currents from several of the cell pairs shown in A. DTR cells are at top; WT cells are below. Current-clamp protocol (middle, aligned with 30 d post-DT data) applies to all.

