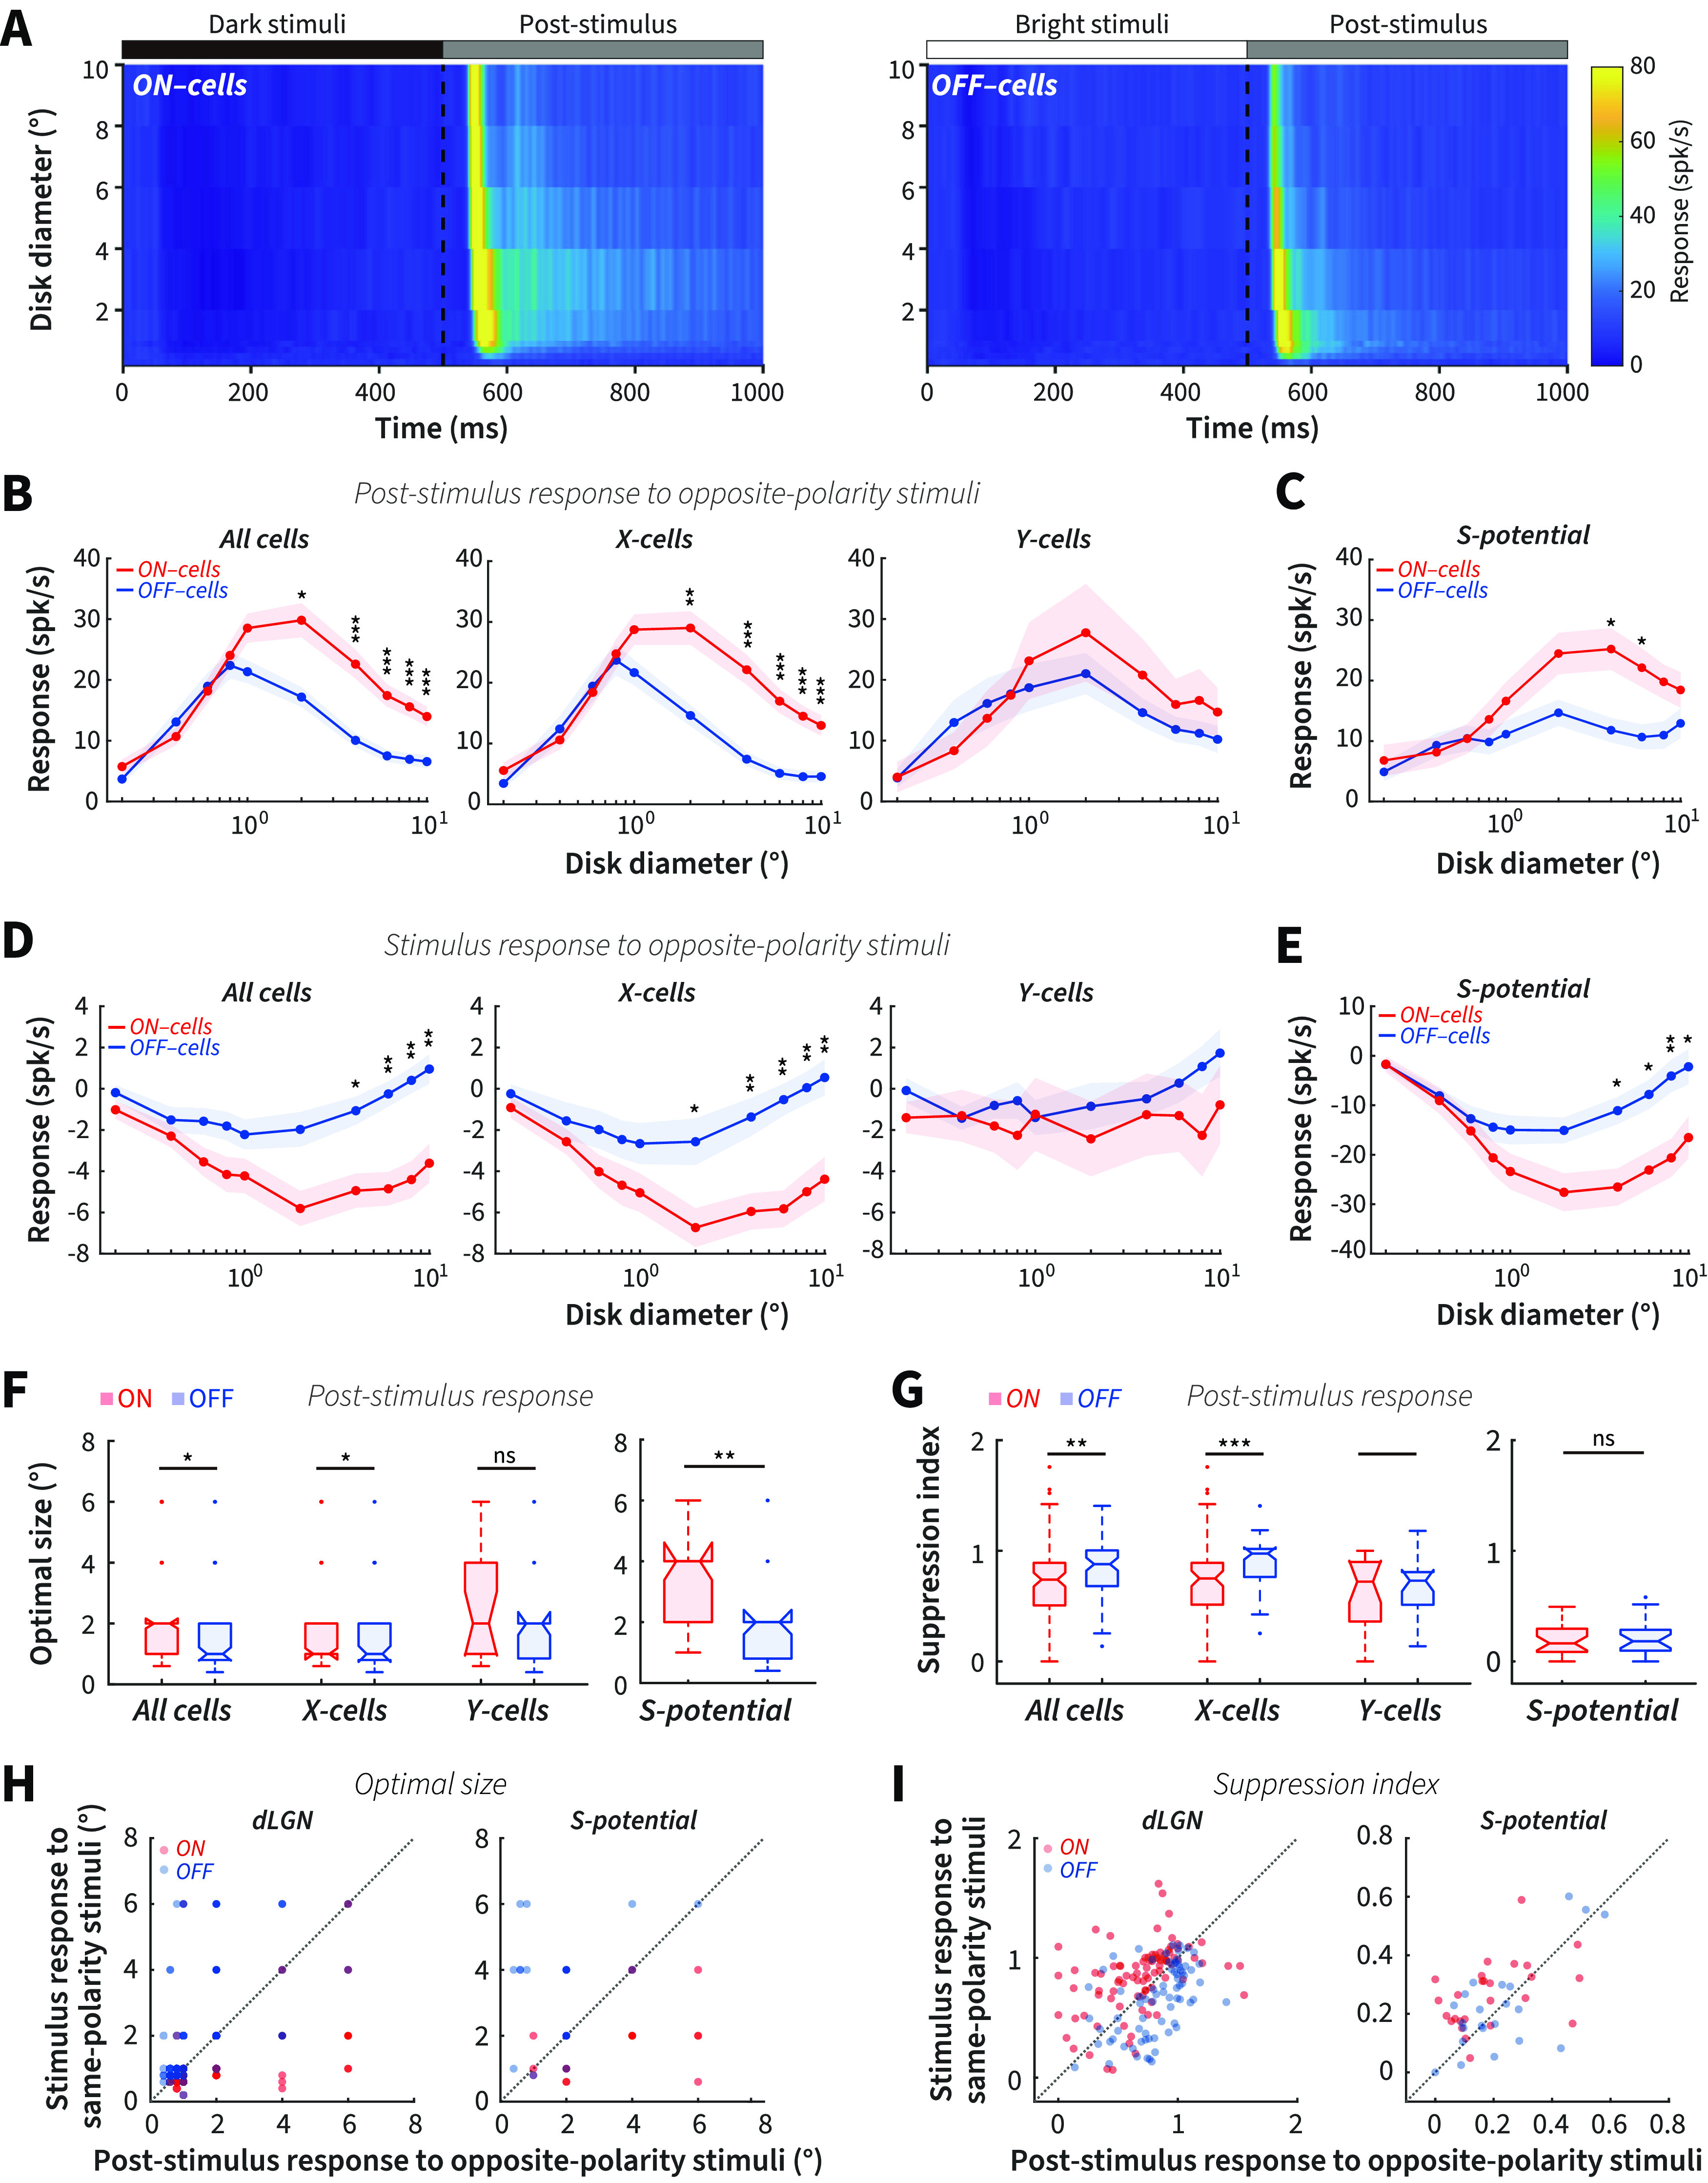
Figure 4.

Stronger post-stimulus responses for ON than OFF cells to opposite-polarity stimuli at large sizes. A, Color-map images of response (z axis) to a series of opposite-polarity stimuli of different diameters (y axis) at different times (x axis) after stimuli onset and offset in ON (left) and OFF cells (right), respectively. B, Size tuning of dLGN ON cells to the offset of dark stimuli and OFF cells to the offset of bright stimuli for all cells (left), X cells (middle), and Y cells (right). C, Size tuning of post-stimulus response for ON- and OFF-RGCs. D, Size tuning of dLGN ON cells to the onset of dark stimuli and OFF cells to the onset of bright stimuli for all cells (left), X cells (middle), and Y cells (right). E, Size tuning of stimulus response to opposite-polarity stimuli for RGCs. F, Average optimal size of post-stimulus responses to opposite-polarity stimuli for dLGN cells (left) and RGCs (right). G, Average suppression index of post-stimulus responses to opposite-polarity stimuli for dLGN cells (left) and RGCs (right). H, Optimal size of stimulus response to same-polarity stimuli plotted against the optimal size of post-stimulus response to opposite-polarity stimuli for dLGN cells (left) and RGCs (right). I, Suppression index of stimulus response to same-polarity stimuli plotted against suppression index of post-stimulus response to opposite-polarity stimuli for dLGN cells (left) and RGCs (right). *p < 0.05. **p < 0.01. ***p < 0.001. ns, Not significant (p > 0.05).
