. 2021 May 28;81(16):4305–4318. doi: 10.1158/0008-5472.CAN-20-3929

Figure 2.

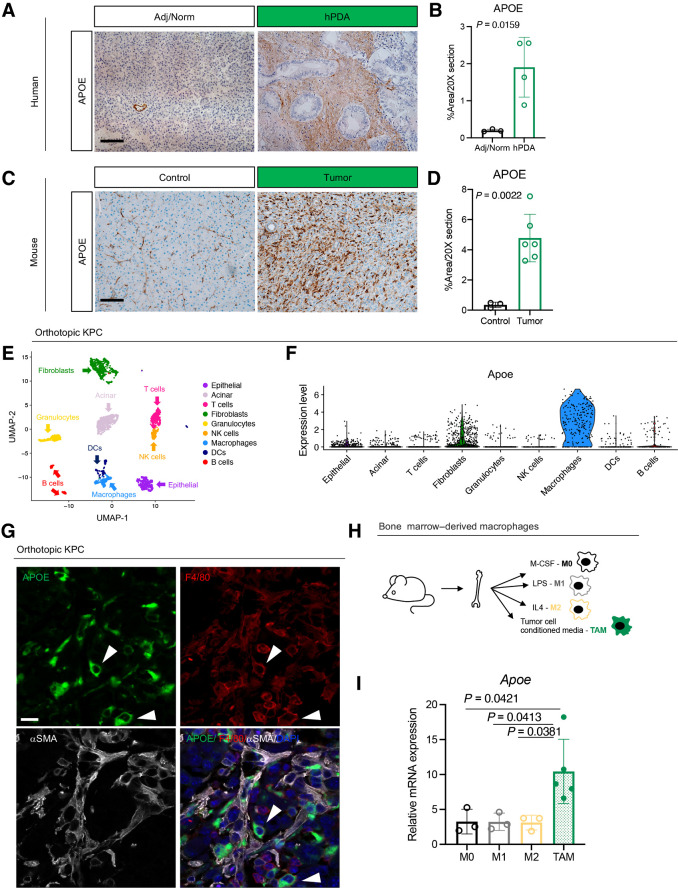
Figure 2. APOE is highly expressed by TAM. A, IHC analysis of APOE in human benign pancreas and PDAC samples. Scale bars, 100 μm. B, Quantitation of positive APOE staining as a percentage of area in a 20× field of view. At least three fields of view were averaged per sample. Adjacent/normal pancreas, n = 3; hPDA, n = 4. Statistical significance was determined using two-tailed t test. C, IHC analysis of APOE in normal mouse pancreas and orthotopic KPC tumor. Scale bars, 100 μm. D, Quantitation of positive APOE staining as a percentage of area in a 20× field of view. Five fields of view were averaged per mouse. Control, n = 3; orthotopic tumor, n = 6. Statistical significance was determined using two-tailed t test. E, UMAP visualization of 9 identified populations in orthotopic KPC tumors (n = 2). F, Violin plot of normalized expression of Apoe in identified cell populations in orthotopic KPC tumors (n = 2). G, Coimmunofluorescence of orthotopic KPC tumor with single channels of APOE (green), F4/80 (red), αSMA (white), and merge to show APOE and F4/80 colocalization. Two examples of APOE and F4/80 colocalization are denoted by white arrowheads. Scale bars, 25 μm. H, Experimental design for bone marrow–derived macrophage polarization assay. I, qRT-PCR analysis of Apoe mRNA levels relative to Cyclophilin A in four macrophage conditions (M0, M1, M2, and TAM). Statistical significance was determined using one-way ANOVA with Tukey test for multiple correction.

APOE is highly expressed by TAM. A, IHC analysis of APOE in human benign pancreas and PDAC samples. Scale bars, 100 μm. B, Quantitation of positive APOE staining as a percentage of area in a 20× field of view. At least three fields of view were averaged per sample. Adjacent/normal pancreas, n = 3; hPDA, n = 4. Statistical significance was determined using two-tailed t test. C, IHC analysis of APOE in normal mouse pancreas and orthotopic KPC tumor. Scale bars, 100 μm. D, Quantitation of positive APOE staining as a percentage of area in a 20× field of view. Five fields of view were averaged per mouse. Control, n = 3; orthotopic tumor, n = 6. Statistical significance was determined using two-tailed t test. E, UMAP visualization of 9 identified populations in orthotopic KPC tumors (n = 2). F, Violin plot of normalized expression of Apoe in identified cell populations in orthotopic KPC tumors (n = 2). G, Coimmunofluorescence of orthotopic KPC tumor with single channels of APOE (green), F4/80 (red), αSMA (white), and merge to show APOE and F4/80 colocalization. Two examples of APOE and F4/80 colocalization are denoted by white arrowheads. Scale bars, 25 μm. H, Experimental design for bone marrow–derived macrophage polarization assay. I, qRT-PCR analysis of Apoe mRNA levels relative to Cyclophilin A in four macrophage conditions (M0, M1, M2, and TAM). Statistical significance was determined using one-way ANOVA with Tukey test for multiple correction.