. 2021 May 28;81(16):4305–4318. doi: 10.1158/0008-5472.CAN-20-3929

Figure 6.

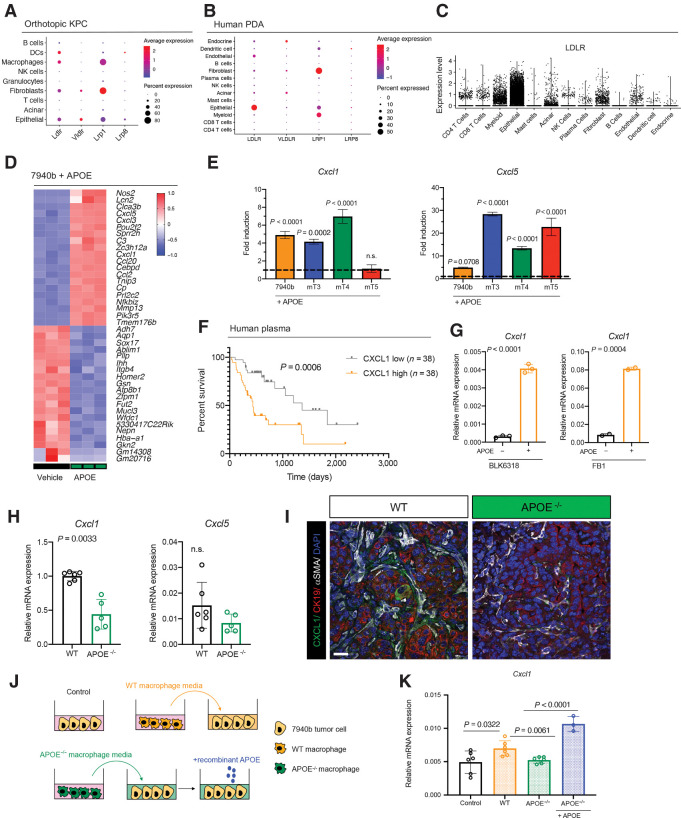
Figure 6. APOE regulates Cxcl1 expression in tumor cells and fibroblasts. A, Dot plot of Ldlr, Vldlr, Lrp1, and Lrp8 in orthotopic KPC samples. Color represents average expression, while size of the dot represents expression frequency. B, Dot plot of LDLR, VLDLR, LRP1, and LRP8 in human PDAC. Color represents average expression, while size of the dot represents expression frequency. C, Violin plot of normalized LDLR expression in human PDAC. D, Heat map of differentially expressed genes in in vitro 7940b KPC cells treated with vehicle (n = 3) compared with 7940b KPC cells treated with 0.3 μg/mL murine recombinant APOE (n = 3) for 48 hours. Red, high expression; blue, low expression. E, qRT-PCR analysis of Cxcl1 and Cxcl5 mRNA levels relative to Cyclophilin A in four KPC cell lines (7940b, mT3, mT4, mT5). Dotted line represents fold induction compared with vehicle-treated cells normalized to 1. Statistical significance was determined using one-way ANOVA with Tukey test for multiple correction. F, Survival analysis of PDAC patients stratified by plasma CXCL1 levels. CXCL1 low, n = 38; CXCL1 high, n = 38. Statistical significance was determined using log-rank (Mantel–Cox) test. G, qRT-PCR analysis for Cxcl1 mRNA levels relative to Cyclophilin A in WT fibroblasts (BLK6318) and CAFs (FB1) treated with vehicle (n = 2–3) or 0.3 μg/mL recombinant ApoE (n = 2–3) for 48 hours. Statistical significance was determined by two-tailed t tests. H, qRT-PCR analysis of Cxcl1 and Cxcl5 mRNA levels relative to Cyclophilin A in WT (n = 6) and ApoE–/− (n = 5) tumors. Statistical significance was determined using two-tailed t test. n.s., not significant. I, Coimmunofluorescence staining of CXCL1 (green), CK19 (red), αSMA (white), and DAPI (blue) in WT and ApoE–/− orthotopic KPC tumors. J, Experimental design schematic. K, qRT-PCR analysis of Cxcl1 mRNA levels relative to Cyclophilin A in 7940b tumor cells alone control (n = 6), 7940b cells cultured with WT macrophage CM (n = 6), 7940b cells cultured with ApoE–/− macrophage CM (n = 6), and 7940b cells cultured with ApoE–/− macrophage CM with 0.3 μg/mL recombinant ApoE (n = 3). Statistical significance was determined by two-tailed t tests between groups.

APOE regulates Cxcl1 expression in tumor cells and fibroblasts. A, Dot plot of Ldlr, Vldlr, Lrp1, and Lrp8 in orthotopic KPC samples. Color represents average expression, while size of the dot represents expression frequency. B, Dot plot of LDLR, VLDLR, LRP1, and LRP8 in human PDAC. Color represents average expression, while size of the dot represents expression frequency. C, Violin plot of normalized LDLR expression in human PDAC. D, Heat map of differentially expressed genes in in vitro 7940b KPC cells treated with vehicle (n = 3) compared with 7940b KPC cells treated with 0.3 μg/mL murine recombinant APOE (n = 3) for 48 hours. Red, high expression; blue, low expression. E, qRT-PCR analysis of Cxcl1 and Cxcl5 mRNA levels relative to Cyclophilin A in four KPC cell lines (7940b, mT3, mT4, mT5). Dotted line represents fold induction compared with vehicle-treated cells normalized to 1. Statistical significance was determined using one-way ANOVA with Tukey test for multiple correction. F, Survival analysis of PDAC patients stratified by plasma CXCL1 levels. CXCL1 low, n = 38; CXCL1 high, n = 38. Statistical significance was determined using log-rank (Mantel–Cox) test. G, qRT-PCR analysis for Cxcl1 mRNA levels relative to Cyclophilin A in WT fibroblasts (BLK6318) and CAFs (FB1) treated with vehicle (n = 2–3) or 0.3 μg/mL recombinant ApoE (n = 2–3) for 48 hours. Statistical significance was determined by two-tailed t tests. H, qRT-PCR analysis of Cxcl1 and Cxcl5 mRNA levels relative to Cyclophilin A in WT (n = 6) and ApoE–/− (n = 5) tumors. Statistical significance was determined using two-tailed t test. n.s., not significant. I, Coimmunofluorescence staining of CXCL1 (green), CK19 (red), αSMA (white), and DAPI (blue) in WT and ApoE–/− orthotopic KPC tumors. J, Experimental design schematic. K, qRT-PCR analysis of Cxcl1 mRNA levels relative to Cyclophilin A in 7940b tumor cells alone control (n = 6), 7940b cells cultured with WT macrophage CM (n = 6), 7940b cells cultured with ApoE–/− macrophage CM (n = 6), and 7940b cells cultured with ApoE–/− macrophage CM with 0.3 μg/mL recombinant ApoE (n = 3). Statistical significance was determined by two-tailed t tests between groups.