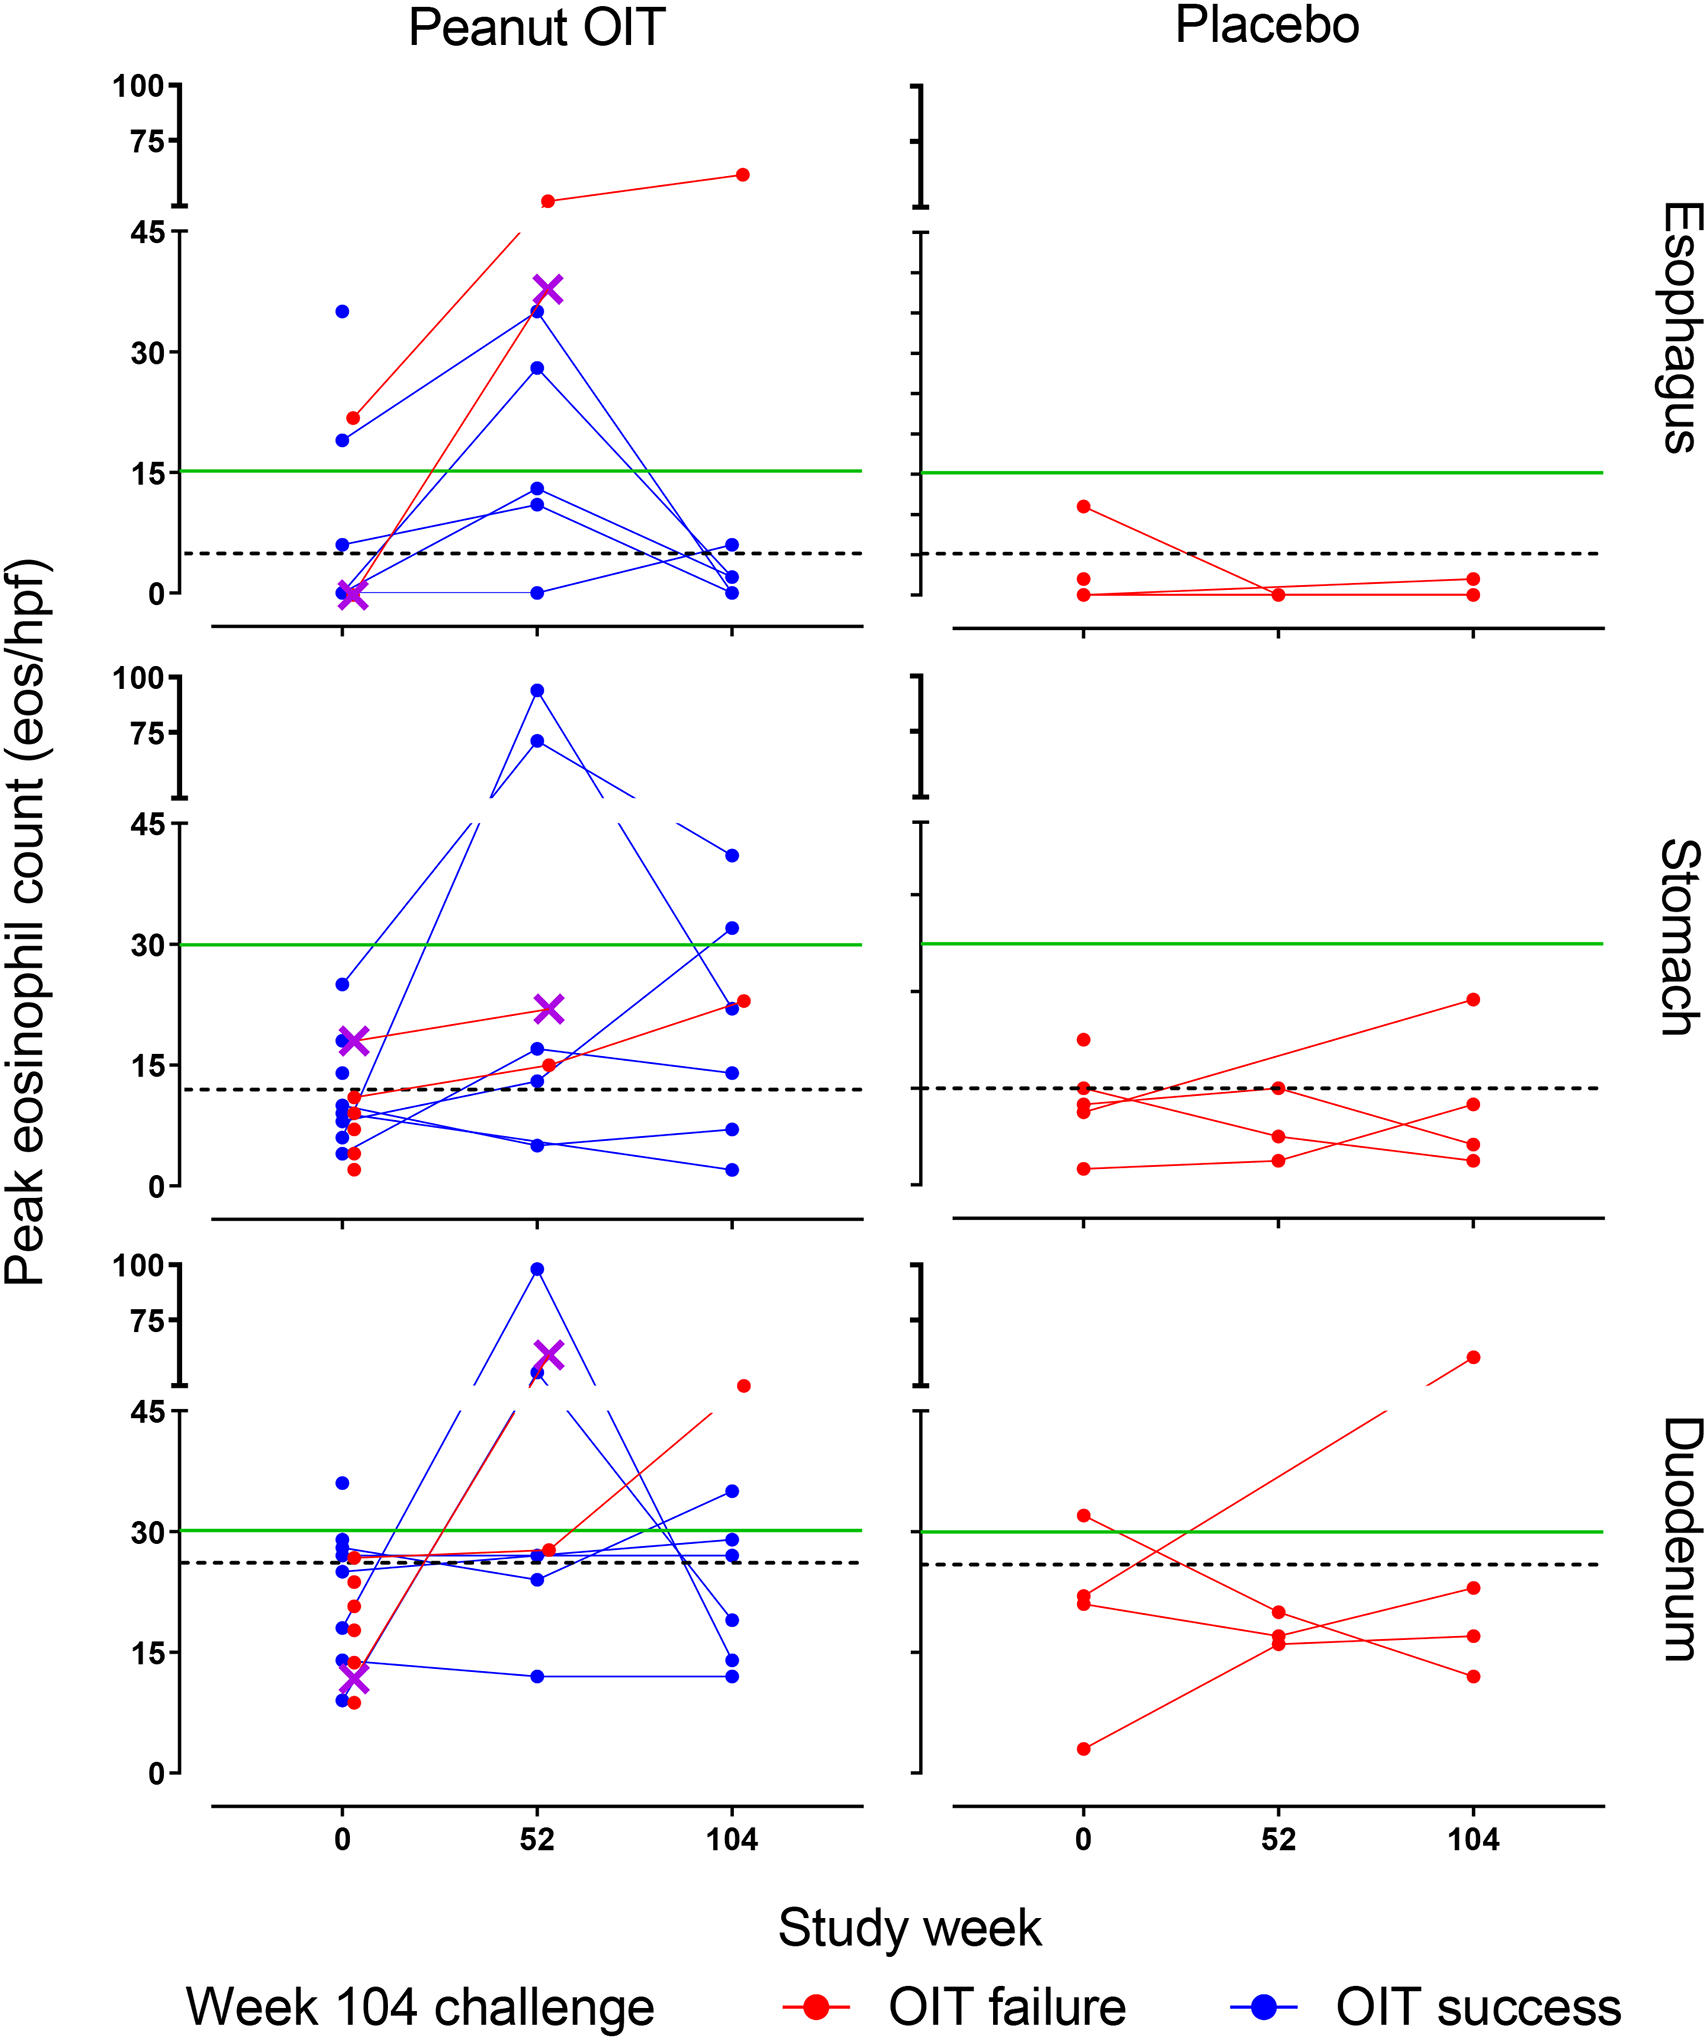
Figure 2.

PEC over time by treatment arm, biopsy site, and week 104 challenge outcome. PEC at week 0 (peanut OIT 15, placebo 5), week 52 (peanut OIT 7, placebo 3), and week 104 (peanut OIT 7, placebo 4). Horizontal dashed black lines indicate upper limit of normal in the esophagus (5 eos/hpf), gastric antrum (12 eos/hpf), and duodenum (26 eos/hpf). Horizontal green line indicates histologic threshold for eosinophilic gastrointestinal disease (≥15 for esophagus, ≥30 for stomach and duodenum). Purple X denotes participant #11, who developed eosinophilic esophagitis, eos/hpf, eosinophils per high-power field; OIT, oral immunotherapy; PEC, peak eosinophil count.
