Figure 4.
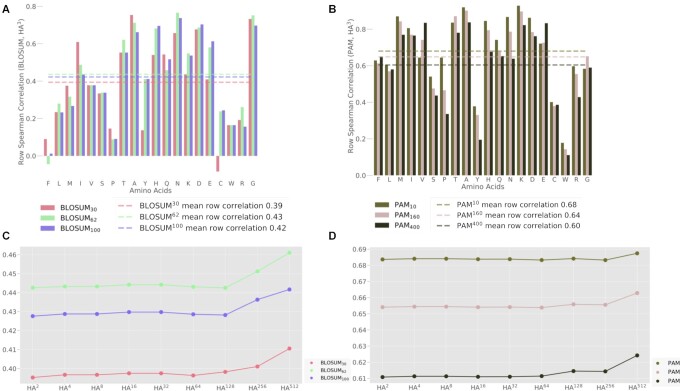
Comparison to the BLOSUM and PAM substitution matrices. (A) Spearman’s correlation coefficients (ρ) between the rows of HA3 and the corresponding rows of different versions of the BLOSUM matrices. For example, the rightmost bar refers to the consistency between the substitution probabilities of glycine (G) according to HA3 and the corresponding substitution scores according to BLOSUM100. Dotted lines signify the average correlation coefficients across all AA. (B) Spearman’s correlation coefficients (ρ) between the rows of HA3 and the corresponding rows of different versions of the PAM matrices. (C) The average correlation coefficients between BLOSUM matrices and different powers of HA1. Increasing powers of HA represent an increasing number of consecutive substitutions (which signify longer evolutionary timescales). (D) Average correlation coefficients between PAM matrices and different powers of HA1.

