
FIG. 2.
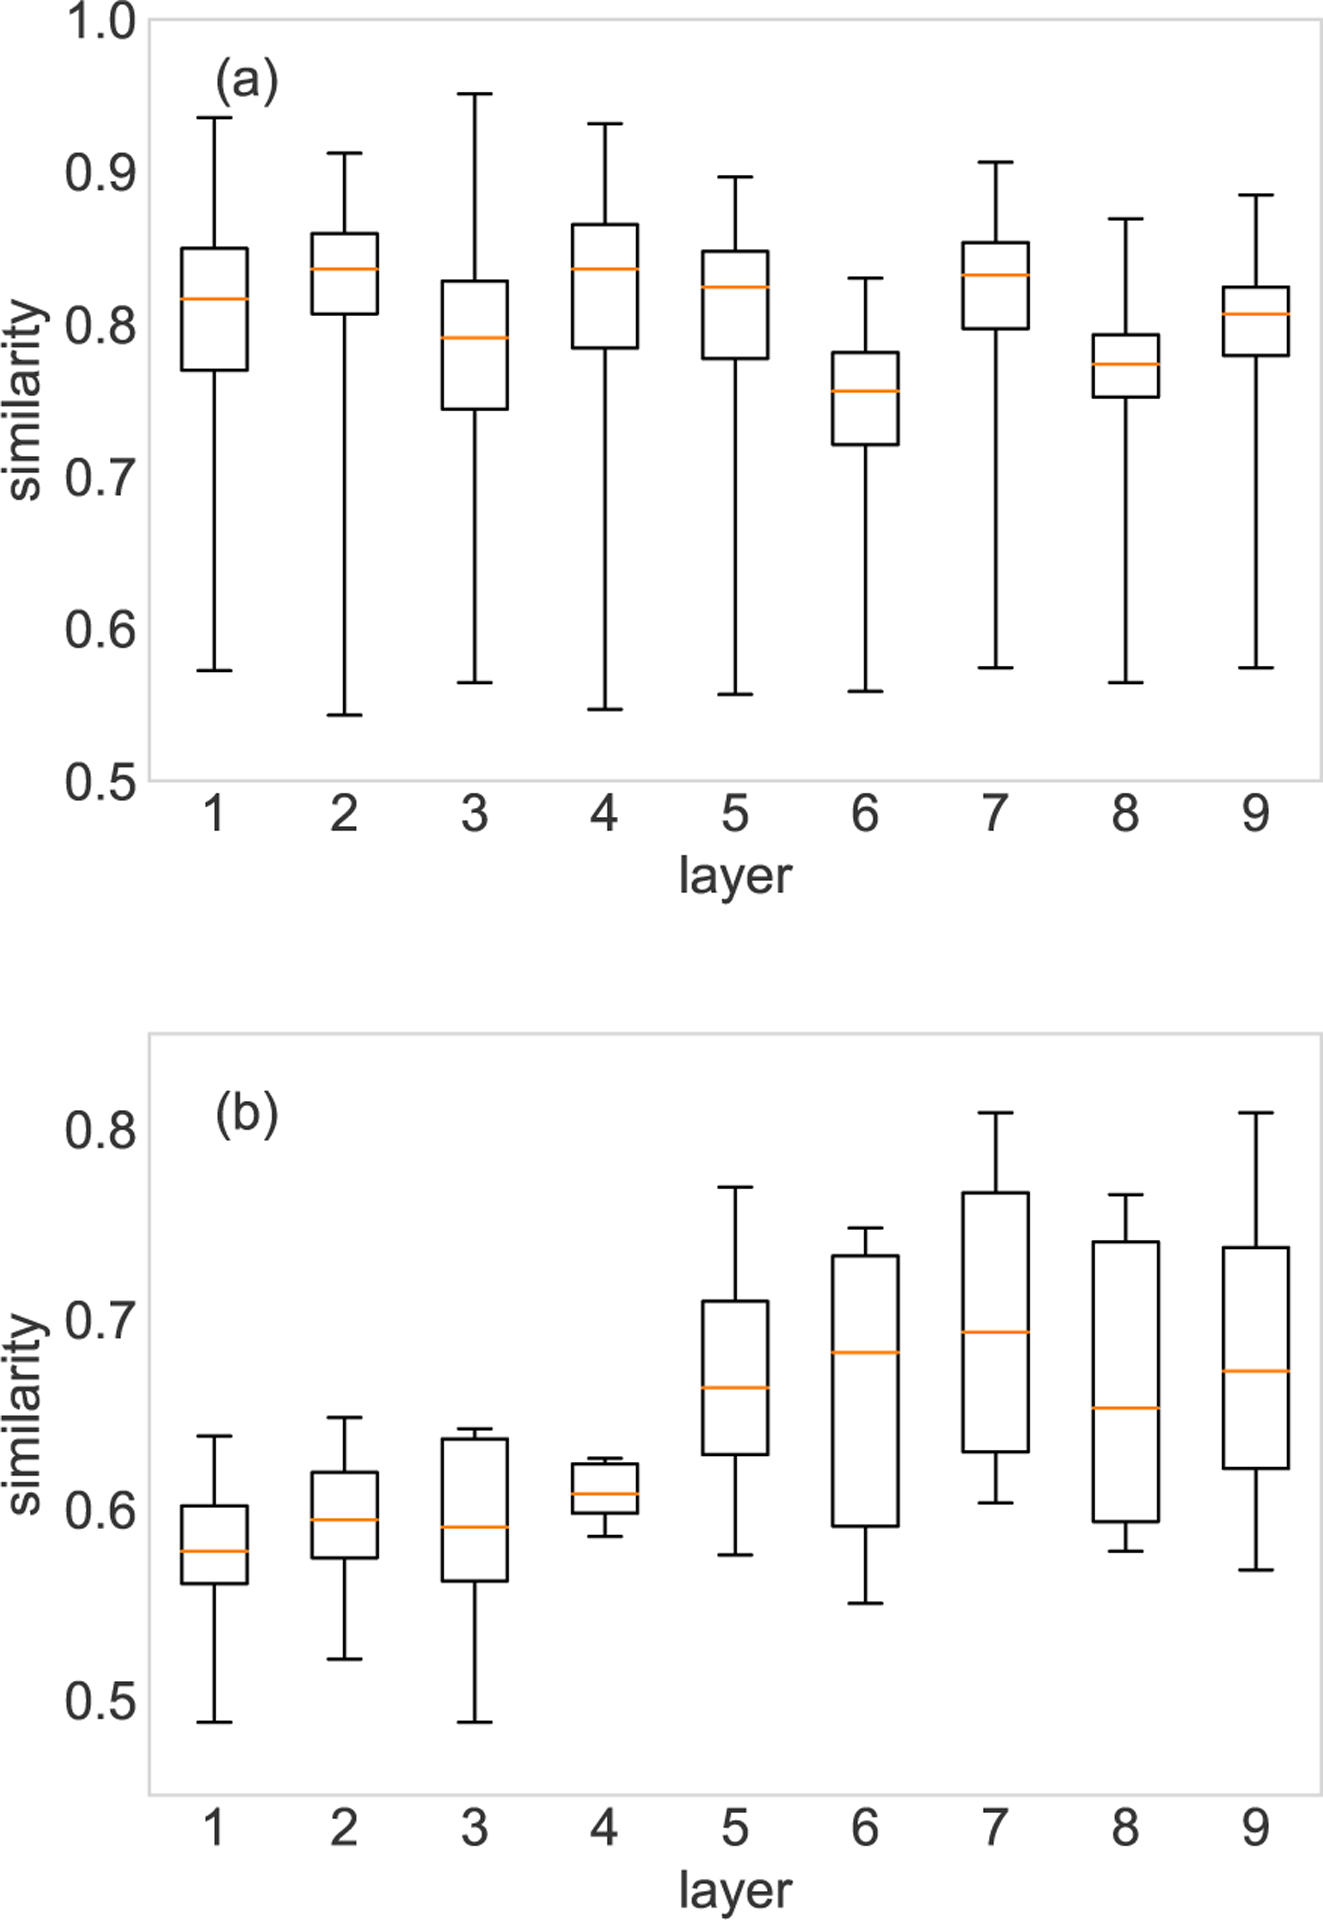
Layer comparison of the FAO network (a) and HVR network (b). (a) shows the similarities between the target layer and all the other 363 layers in the FAO network. (b) shows the similarities between the target layer and the other eight layers in the HVR network. Note that each similarity value is averaged over 10 runs.